Buyer TipsFriday Fun FactsReal EstateSeller TipsUncategorized March 20, 2020

Economist’s Perspective

Our Chief Economist made a video for all of our clients where he shares his perspective on COVID-19’s impact on

housing.  You can watch it by clicking the image below:


Buyer TipsFriday Fun FactsHomes for SaleInvestmentReal EstateSeller Tips March 13, 2020

Headwind Vs. Tailwind

Headwind vs. Tailwind

So far the tailwind of historically-low mortgage rates are prevailing over Wall Street and COVID-19 concerns.

Buyers are still active. Properties are still closing. Moving trucks are still showing up at people’s homes.

Open house traffic has declined, but we notice plenty of buyers looking for property. (one of our open houses last weekend had over 40 visitors)

For many, the interest rates are just too good to pass up.

We even see instances of multiple-offer situations for properties priced right in high-demand locations.

Rates today, compared to 4%, equate to not only a monthly savings for those refinancing but also equates to tens of thousands in additional purchase power.

For the average price of a home on the Front Range, the savings is $171 per month and the increased purchase power is $35,811.

Here’s what we expect to happen over the coming months. Listing inventory and transaction volume will both decline. We will no doubt see lower activity compared to a year ago.

But thoughts of the market “coming to a screeching halt” can’t be validated because of the historical performance of our market and because of the inherent fundamentals in place.

We will continue to track the numbers and communicate the facts so that you remain well-informed.

Uncategorized February 3, 2020

New Edition Of THE SCOOP!

Check out The Scoop all about the Northern Colorado real estate market below!

The Scoop 1st Quarter 2020


About the areaBuyer TipsEvans Real EstateFort Collins Real EstateHomes for SaleInvestmentLoveland Real EstateReal EstateSeller TipsWellington Real EstateWindsor Real Estate February 4, 2019

The Gardner Report

Check out the latest Gardner Report from Windermere’s Economist Matthew Gardner by clicking the picture below!

About the areaBuyer TipsEvans Real EstateFort Collins Real EstateHomes for SaleInvestmentLoveland Real EstateReal EstateSeller TipsWellington Real EstateWindsor Real Estate January 6, 2019

2019 Economic and Housing Forecast Preview

2019 Economic and Housing Forecast 
By Matthew Gardner, Chief Economist, Windermere Real Estate 

What a year it has been for both for the U.S. economy and the national housing market. After several years of above-average economic and home price growth, 2018 marked the start of a slowdown in the residential real estate market. As the year comes to a close, it’s time for me to dust off my crystal ball to see what we can expect in 2019.

The U.S. Economy

Despite the turbulence that the ongoing trade wars with China are causing, I still expect the U.S. economy to have one more year of relatively solid growth before we likely enter a recession in 2020. Yes, it’s the dreaded “R” word, but before you panic, there are some things to bear in mind.

Firstly, any cyclical downturn will not be driven by housing. Although it is almost impossible to predict exactly what will be the “straw that breaks the camel’s back”, I believe it will likely be caused by one of the following three things: an ongoing trade war, the Federal Reserve raising interest rates too quickly, or excessive corporate debt levels. That said, we still have another year of solid growth ahead of us, so I think it’s more important to focus on 2019 for now.

The U.S. Housing Market

Existing Home Sales
This paper is being written well before the year-end numbers come out, but I expect 2018 home sales will be about 3.5% lower than the prior year. Sales started to slow last spring as we breached affordability limits and more homes came on the market. In 2019, I anticipate that home sales will rebound modestly and rise by 1.9% to a little over 5.4 million units.

Existing Home Prices
We will likely end 2018 with a median home price of about $260,000 – up 5.4% from 2017. In 2019 I expect prices to continue rising, but at a slower rate as we move toward a more balanced housing market. I’m forecasting the median home price to increase by 4.4% as rising mortgage rates continue to act as a headwind to home price growth.

New Home Sales
In a somewhat similar manner to existing home sales, new home sales started to slow in the spring of 2018, but the overall trend has been positive since 2011. I expect that to continue in 2019 with sales increasing by 6.9% to 695,000 units – the highest level seen since 2007.

That being said, the level of new construction remains well below the long-term average. Builders continue to struggle with land, labor, and material costs, and this is an issue that is not likely to be solved in 2019. Furthermore, these constraints are forcing developers to primarily build higher-priced homes, which does little to meet the substantial demand by first-time buyers.

Mortgage Rates
In last year’s forecast I suggested that 5% interest rates would be a 2019 story, not a 2018 story. This prediction has proven accurate with the average 30-year conforming rates measured at 4.87% in November, and highly unlikely to breach the 5% barrier before the end of the year.

In 2019, I expect interest rates to continue trending higher, but we may see periods of modest contraction or levelling. We will likely end the year with the 30-year fixed rate at around 5.7%, which means that 6% interest rates are more apt to be a 2020 story.

I also believe that non-conforming (or jumbo) rates will remain remarkably competitive. Banks appear to be comfortable with the risk and ultimately, the return, that this product offers, so expect jumbo loan yields to track conforming loans quite closely.

Conclusions
There are still voices out there that seem to suggest the housing market is headed for calamity and that another housing bubble is forming, or in some cases, is already deflating.  In all the data that I review, I just don’t see this happening. Credit quality for new mortgage holders remains very high and the median down payment (as a percentage of home price) is at its highest level since 2004.

That is not to say that there aren’t several markets around the country that are overpriced, but just because a market is overvalued, does not mean that a bubble is in place. It simply means that forward price growth in these markets will be lower to allow income levels to rise sufficiently.

Finally, if there is a big story for 2019, I believe it will be the ongoing resurgence of first-time buyers. While these buyers face challenges regarding student debt and the ability to save for a down payment, they are definitely on the comeback and likely to purchase more homes next year than any other buyer demographic.

About the areaBuyer TipsFort Collins Real EstateHomes for SaleInvestmentLoveland Real EstateReal EstateSeller TipsWellington Real EstateWindsor Real Estate December 14, 2018

Friday Fun Facts

Waiting and Waiting

Anytime the market cools off we sometimes hear prospective buyers say “I think I’ll wait for the market to correct, then I’ll buy after prices come way down.”

The reality is this… History shows that this wouldn’t be a good strategy.

Our go-to source on price appreciation is the Federal Housing Finance Authority who produces a quarterly home price index.  They have been tracking Larimer County for 41 years.

Their numbers show:

  • Yearly prices have decreased only 6 times in history
  • The average amount of that decrease is only 1.7%

So, someone who is waiting for prices to drop:

  • Might be waiting a long time
  • Might be disappointed that prices didn’t drop by all that much

If you have any questions about any of this info, feel free to give me a call or shoot me an email, have a great weekend!

About the areaBuyer TipsFort Collins Real EstateHomes for SaleInvestmentLoveland Real EstateReal EstateSeller TipsWellington Real EstateWindsor Real Estate September 21, 2018

Friday Fun Facts – Appreciation

About the areaBuyer TipsFort Collins Real EstateHomes for SaleInvestmentReal EstateSeller Tips September 10, 2018

Fort Collins Real Estate: Dual Markets

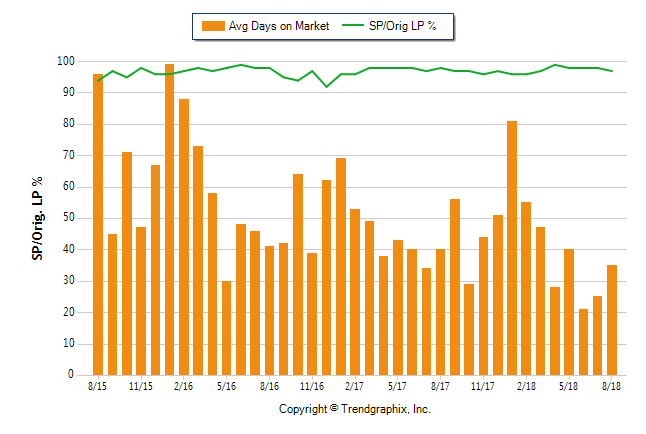
You may hear how the market is still blazing fast and homes are selling in just days, and you may hear that the market is slowing down and it is becoming more normalized. Here’s the truth……both of those statements are true! We essentially have a tale of two markets in Fort Collins, the one under $500,000 and the one over $500,000. Check out the graph below to see how quickly homes are selling in the market UNDER $500,000.

Under $500k

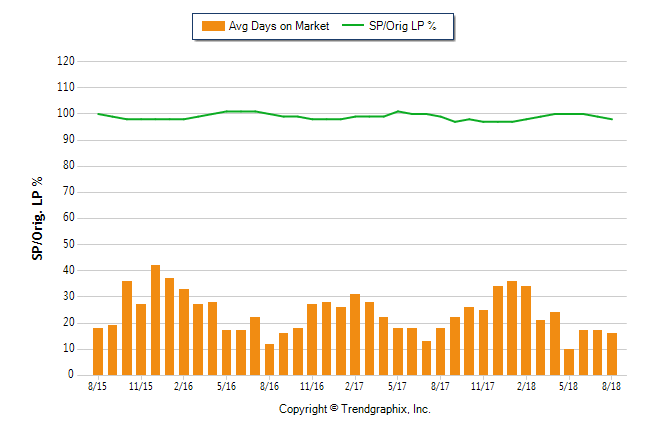
Now check out what the average days on market over $500,000 in Fort Collins looks like, quite the difference!

Over $500k

This is NOT terrible news for the over $500,000 market by the way. Now more than ever it is important to stand out from the crowd if you have a more expensive home, and our Windermere Premier Certified Listing program can help you feel like you are still in the super hot market of this past spring.

If you ever have any questions for me, please don’t hesitate to give me a ring or shoot me an email. Have a great week!

About the areaBuyer TipsFort Collins Real EstateHomes for SaleInvestmentLoveland Real EstateReal EstateSeller TipsWellington Real EstateWindsor Real Estate August 3, 2018

New Gardner Report

Colorado Real Estate Market Update

ECONOMIC OVERVIEW

Colorado continues to see very strong job growth, adding 72,800 non-agricultural jobs over the past 12 months—an impressive increase of 2.7%. Through the first five months of 2018, the state added an average of 7,300 new jobs per month. I expect this growth to continue through the remainder of the year, resulting in about 80,000 new jobs in 2018.

In May, the state unemployment rate was 2.8%. This is slightly above the 2.6% we saw a year ago but still represents a remarkably low level. Unemployment remains either stable or is dropping in all the markets contained in this report, with the lowest reported rates in Fort Collins and Boulder, where just 2.2% of the labor force was actively looking for work. The highest unemployment rate was in Grand Junction, which came in at 3.1%.


HOME SALES ACTIVITY

  • In the second quarter of 2018, 17,769 homes sold—a drop of 2.4% compared to the second quarter of 2017.
  • Sales rose in 5 of the 11 counties contained in this report, with Gilpin County sales rising by an impressive 10.7% compared to second quarter of last year. There were also noticeable increases in Clear Creek and Weld Counties. Sales fell the most in Park County but, as this is a relatively small area, I see no great cause for concern at this time.
  • Slowing sales activity is to be expected given the low levels of available homes for sale in many of the counties contained in this report. That said, we did see some significant increases in listing activity in Denver and Larimer Counties. This should translate into increasing sales through the summer months.
  • The takeaway here is that sales growth is being hobbled by a general lack of homes for sale, and due to a drop in housing demand.


HOME PRICES

  • With strong economic growth and a persistent lack of inventory, prices continue to trend higher. The average home price in the region rose
    9.8% year-over-year to $479,943.
  • The smallest price gains in the region were in Park County, though the increase there was still a respectable 7%.
  • Appreciation was strongest in Clear Creek and Gilpin Counties, where prices rose by 28.9% and 26%, respectively. All other counties in this report saw gains above the long-term average.
  • Although there was some growth in listings, the ongoing imbalance between supply and demand persists, driving home prices higher.


DAYS ON MARKET

  • The average number of days it took to sell a home remained at the same level as a year ago.
  • The length of time it took to sell a home dropped in most markets contained in this report. Gilpin County saw a very significant jump in days on market, but this can be attributed to the fact that it is a very small area which makes it prone to severe swings.
  • In the second quarter of 2018, it took an average of 24 days to sell a home. Of note is Adams County, where it took an average of only 10 days to sell a home.
  • Housing demand remains very strong and all the markets in this report continue to be in dire need of additional inventory to satisfy demand.


CONCLUSIONS

This speedometer reflects the state of the region’s real estate market using housing inventory, price gains, home sales, interest rates, and larger economic factors.

For the second quarter of 2018, I have moved the needle very slightly towards buyers as a few counties actually saw inventories rise. However, while I expect to see listings increase in the coming months, for now, the housing market continues to heavily favor sellers.


Matthew Gardner is the Chief Economist for Windermere Real Estate, specializing in residential market analysis, commercial/industrial market analysis, financial analysis, and land use and regional economics. He is the former Principal of Gardner Economics, and has more than 30 years of professional experience both in the U.S. and U.K.


About the areaBuyer TipsFort Collins Real EstateLoveland Real EstateReal EstateWellington Real EstateWindsor Real Estate December 11, 2017

Get Real

A story ran last week which highlighted the number of people who have moved out of Colorado.

Let’s get real, there are still a large number of people moving to Colorado.

In fact, 223,000 moved to Colorado from another state last year according to the latest American Community Survey from the U.S. Census Bureau.

The net migration into our state (after subtracting out people who left) was 30,859 people.

In Northern Colorado the net migration looks like this:

  • Larimer County = 7,001 people
  • Weld County = 7,117 people

So what does that mean for housing? Knowing that, on average, 2.5 people live in each household, the number of new housing units required for these new residents looks like this:

  • Larimer County = 2,800 new housing units
  • Weld County = 2,847 new housing units

Any questions about this information, give me a call!