About the areaBuyer TipsFort Collins Real EstateHomes for SaleLoveland Real EstateReal EstateSeller TipsWellington Real EstateWindsor Real Estate November 16, 2018

Real Estate Update – The Gardner Report


The following analysis of the Metro Denver & Northern Colorado real estate market (which now includes Clear Creek, Gilpin, and Park Counties) is provided by Windermere Real Estate Chief Economist Matthew Gardner. We hope that this information may assist you with making better-informed real estate decisions. For further information about the housing market in your area, please don’t hesitate to contact your Windermere agent.


ECONOMIC OVERVIEW

The Colorado economy continues to perform quite well, having added 72,200 non-agricultural jobs over the past 12 months — a solid growth rate of 2.7%. Through the first eight months of 2018, the state has added an average of 6,700 new jobs per month. There has been a modest slowdown in employment gains, but I really don’t think this is a cause for concern and still hold to my forecast that Colorado will add a total of 82,000 new jobs by the end of 2018.

In August, the state unemployment rate was 2.9%. This matches the level seen a year ago. Unemployment rates in all the markets contained in this report rose between August 2017 and August 2018 but this is not actually a concern. Growth in the workforce is not only due to recent college graduates, but also discouraged workers who are starting to look for work again and this puts upward pressure on the unemployment rate. All of Colorado’s metropolitan areas are showing unemployment rates at around 4% or lower, suggesting that the regional economies are at, or close to, full employment.


HOME SALES ACTIVITY

  • In the third quarter of 2018, 16,550 homes sold — a drop of 6.2% compared to the third quarter of 2017.
  • Sales rose in just two of the 11 counties contained in this report. Gilpin County again led the way, with sales rising by an impressive 21.1% compared to third quarter of last year. There was also a significant increase in Clear Creek County. Sales fell the most in Arapahoe County.
  • Slowing sales in the quarter can, to a degree, be attributed to continued home price growth, but I believe it is more a function of the rapid rise in the number of homes for sale. The number of listings in third quarter rose by 5.4% over the same period in 2017, but was up by 31.2% compared to the second quarter of this year.
  • What the numbers are telling us is that inventory growth is giving buyers more choice and they are being far more selective — and patient — before making an offer on a home.


HOME PRICES

  • Even with the rapid rise in listings and slowing home sales, prices continue to trend higher. The average home price in the region rose 7.9% year-over-year to $460,982. However, the average price dropped 4% between second and third quarters.
  • The smallest price gains in the region were in Park County, where prices rose by a fairly modest 3.6%.
  • Appreciation was strongest in Clear Creek County, where prices rose 10%. All other counties in this report saw gains relative to the third quarter of 2017.
  • Affordability is becoming an issue in many Colorado markets and this, in concert with rising inventory levels, has started to dampen home price growth. Although I do not expect prices to drop, I do think price gains will moderate over the next few quarters.


DAYS ON MARKET

  • The average number of days it took to sell a home in Colorado remained at the same level as a year ago.
  • The amount of time it took to sell a home dropped in three counties: Gilpin, Clear Creek, and Larimer. The rest of the counties in this report saw days on market rise by only a couple of days or less.
  • In the third quarter of 2018, it took an average of 24 days to sell a home. It took less than a month to sell a home in all but one county.
  • Housing demand is still solid and, as long as homes are priced appropriately, they will continue to sell in less time than historic averages.


CONCLUSIONS

This speedometer reflects the state of the region’s real estate market using housing inventory, price gains, home sales, interest rates, and larger economic factors.

For the third quarter of 2018, I continue the trend that I started last quarter and have moved the needle a little more in favor of buyers. Listings are likely to continue their rising trend, but we should still see a seasonal drop off during the winter months. The market is clearly headed toward balance, which I am very pleased to see.


Matthew Gardner is the Chief Economist for Windermere Real Estate, specializing in residential market analysis, commercial/industrial market analysis, financial analysis, and land use and regional economics. He is the former Principal of Gardner Economics, and has more than 30 years of professional experience both in the U.S. and U.K.

About the areaBuyer TipsFort Collins Real EstateHomes for SaleInvestmentLoveland Real EstateReal EstateSeller TipsWellington Real EstateWindsor Real Estate November 12, 2018

96.3 Miles Per Hour

96.3 Miles Per Hour


Pretend you have been driving on the Interstate at 100 miles per hour.

Also, pretend you have been doing that for a long time.

Now pretend you slow down to 96.3 miles per hour.

How would that feel?

Probably just a little slower?

96.3 miles per hour is a 3.7% decrease from 100. It may feel slower, but it’s still pretty fast.

How does this relate to real estate?

Well, the market has been moving fast for a long time.

It’s been going 100 miles per hour for at least two years (some would argue even longer).

We’ve recently seen a 3.7% change in terms of number of transactions that are occurring.

There were 3.7% fewer sales in September 2018 versus September 2017 in Fort Collins.

It feels slower because we’ve been driving so fast for so long. But, our market is still moving.

For example, prices are still up. So, remember, that it’s all relative.

About the areaBuyer TipsFort Collins Real EstateInvestmentReal EstateSeller Tips October 29, 2018

Absorption Rate Changes

You may have heard the real estate market is changing. While this is true, if you have read any articles that say the sky is falling please understand that scary stories get you to click on news websites, and that’s what they are counting on!

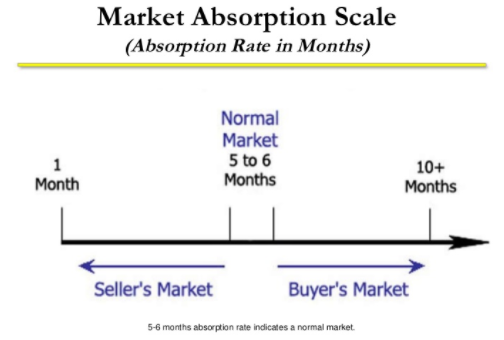
I have tracked the Fort Collins absorption rate since 2011 and keep a running spreadsheet on a quarterly basis of inventory levels and the rate of absorption (the rate at which available homes are sold in a specific real estate market during a given time period. It is calculated by dividing the average number of sales per month by the total number of available homes). The good news for sellers is that inventory is still historically VERY low, it was at only 1.81 months and a balanced market is 6 months. The interesting number was the much lower absorption rate of 55%. We haven’t seen numbers that low on a consistent basis since the end of 2013 heading in to 2014. All this means is that homes are not being “absorbed” in to the market as quickly, so that could mean some great opportunities for buyers. With increasing interest rates and appreciation still on the horizon, now could be a good time to find a home and potentially not even have to compete with 10 other offers (Buyers should be cheering for that right now!).

If you have any questions on how this data could affect your decision to buy or sell, just give me a call or shoot me an email. I’d be happy to take you to coffee or lunch to discuss!

About the areaBuyer TipsFort Collins Real EstateHomes for SaleInvestmentLoveland Real EstateReal EstateSeller TipsWellington Real EstateWindsor Real Estate October 19, 2018

Friday Fun Facts! A History Lesson

About the areaBuyer TipsFort Collins Real EstateHomes for SaleInvestmentLoveland Real EstateReal EstateSeller TipsWellington Real EstateWindsor Real Estate September 21, 2018

Friday Fun Facts – Appreciation

About the areaBuyer TipsFort Collins Real EstateHomes for SaleInvestmentReal EstateSeller Tips September 10, 2018

Fort Collins Real Estate: Dual Markets

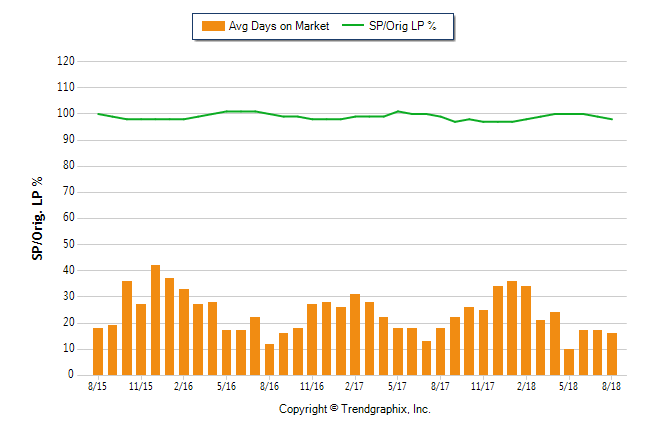
You may hear how the market is still blazing fast and homes are selling in just days, and you may hear that the market is slowing down and it is becoming more normalized. Here’s the truth……both of those statements are true! We essentially have a tale of two markets in Fort Collins, the one under $500,000 and the one over $500,000. Check out the graph below to see how quickly homes are selling in the market UNDER $500,000.

Under $500k

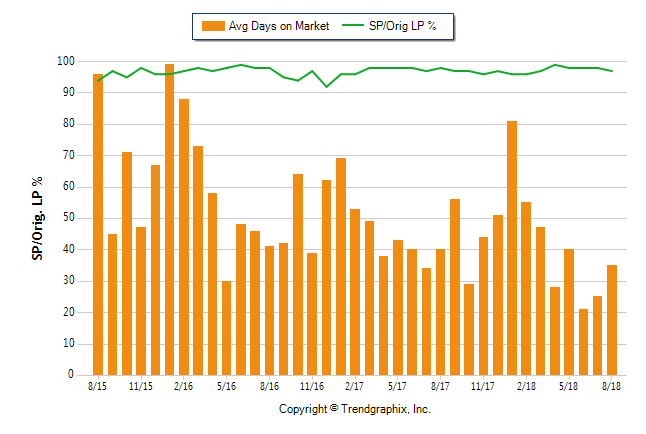
Now check out what the average days on market over $500,000 in Fort Collins looks like, quite the difference!

Over $500k

This is NOT terrible news for the over $500,000 market by the way. Now more than ever it is important to stand out from the crowd if you have a more expensive home, and our Windermere Premier Certified Listing program can help you feel like you are still in the super hot market of this past spring.

If you ever have any questions for me, please don’t hesitate to give me a ring or shoot me an email. Have a great week!

About the areaBuyer TipsFort Collins Real EstateHomes for SaleInvestmentLoveland Real EstateReal EstateSeller TipsWellington Real EstateWindsor Real Estate August 31, 2018

Friday Fun Facts!

About the areaBuyer TipsFort Collins Real EstateLoveland Real EstateReal EstateSeller TipsWindsor Real Estate May 18, 2018

Friday Fun Facts! I-25 Edition

image

Relief on The Way!

There is good news and bad news.

The good news is I-25 traffic relief is on the way. The bad news is we will have to live through three summers of construction before it’s done.

Did you know the 26 miles between Highway 14 in Fort Collins and Highway 66 in Longmont Interstate 25 serves more than 45,000 cars per day? Wow!

Part of that stretch of interstate will get a third lane starting this summer. Construction is set to begin next month that will add a third lane between Highway 14 and Highway 402.

The project is happening 14 years ahead of schedule thanks to additional funding from several sources including the Cities of Fort Collins and Loveland. The first step we will notice is construction on the I 25/Highway 34 intersection.

This is great news for our region that will bring much needed relief. We will all just need to be a little patient while the work is being done.

Grab a copy of my Investment Kit so you can see the simple steps to get started without stress or complication. Email me at phunter@windermere.comand I will send you a video which clarifies the process and my Investment Checklist so you can see what to do first.

About the areaBuyer TipsFort Collins Real EstateHomes for SaleReal EstateSeller Tips May 11, 2018

Friday Fun Facts – 66% Off!

This just in…

For the month of April, the average price of a home in the city of Boulder was $1,247,000. This is according to the latest from our IRES MLS system.

If you want to own a home about an hour down the road in another really nice college town and get a 66% discount, you may want to check out Fort Collins 🙂

Yes, despite the recent uptick in prices here locally, we are still a bargain compared to Boulder. Here are median single-family prices for our markets and their relative price to Boulder:

  • Fort Collins = $414,237 (66.8% off)
  • Loveland = $360,150 (71.1% off)
  • Greeley = $290,000 (76.7% off)
  • Windsor = $306,450 (75.4% off)

Grab a copy of my Investment Kit so you can see the simple steps to get started without stress or complication. Email me at phunter@windermere.com and I will send you a video which clarifies the process and my Investment Checklist so you can see what to do first.

About the areaBuyer TipsFort Collins Real EstateInvestmentLoveland Real EstateReal EstateSeller TipsWellington Real EstateWindsor Real Estate May 7, 2018

The New Gardner Report


The following analysis of the Metro Denver & Northern Colorado real estate market is provided by Windermere Real Estate Chief Economist Matthew Gardner. We hope that this information may assist you with making better-informed real estate decisions. For further information about the housing market in your area, please don’t hesitate to contact me.


ECONOMIC OVERVIEW

It’s good news for the state of Colorado, which saw annual employment grow in all of the metropolitan markets included in this report. The state added 63,400 non-agricultural jobs over the past 12 months, an impressive growth rate of 2.4%. Colorado has been adding an average of 5,300 new jobs per month for the past year, and I anticipate that this growth rate will continue through the balance of 2018.

In February, the unemployment rate in Colorado was 3.0%—a level that has held steady for the past six months. Unemployment has dropped in all the markets contained in this report, with the lowest reported rates in Fort Collins and Denver, where 3.1% of the labor force was actively looking for work. The highest unemployment rate was in Grand Junction, which came in at 4.6%.


HOME SALES ACTIVITY

  • In the first quarter of 2018, there were 11,173 home sales—a drop of 5.6% when compared to the first quarter of 2017.
  • With an increase of 5.3%, home sales rose the fastest in Boulder County, as compared to first quarter of last year. There was also a modest sales increase of 1.2% in Larimer County. Sales fell in all the other counties contained within this report.
  • Home sales continue to slow due to low inventory levels, which were down 5.7% compared to a year ago.
  • The takeaway here is that sales growth continues to stagnate due to the lack of homes for sale.


HOME PRICES

  • Strong economic growth, combined with limited inventory, continued to push prices higher. The average home price in the markets covered by this report was up by 11.7% year-over-year to $448,687.
  • Arapahoe County saw slower appreciation in home values, but the trend is still positiveand above its long-term average.
  • Appreciation was strongest in Boulder County, which saw prices rise 14.8%. Almost all other counties in this report experienced solid gains.
  • The ongoing imbalance between supply and demand persists and home prices continue to appreciate at above-average rates.


DAYS ON MARKET

  • The average number of days it took to sell a home dropped by three days when compared to the first quarter of 2017.
  • Homes in all but two counties contained in this report took less than a month to sell. Adams County continues to stand out where it took an average of just 17 days to sell a home.
  • During the first quarter, it took an average of 27 days to sell a home. That rate is down 2 days from the fourth quarter of 2017.
  • Housing demand remains strong and would-be buyers should expect to see stiff competition for well-positioned, well-priced homes.


CONCLUSIONS

This speedometer reflects the state of the region’s housing market using housing inventory, price gains, home sales, interest rates, and larger economic factors. In the first quarter of 2018, I have left the needle where it was in the fourth quarter of last year. Even as interest rates trend higher, it appears as if demand will continue to outweigh supply. As we head into the spring months, I had hoped to see an increase in the number of homes for sale, but so far that has not happened. As a result, the housing market continues to heavily favor sellers.


Matthew Gardner is the Chief Economist for Windermere Real Estate, specializing in residential market analysis, commercial/industrial market analysis, financial analysis, and land use and regional economics. He is the former Principal of Gardner Economics, and has more than 30 years of professional experience both in the U.S. and U.K.