Facebook
 Twitter
 Pinterest
 Copy Link
Friday Fun Facts!

|

|
|
|
|
|
Friday Fun Facts! I-25 Edition
|
|
|
|
Friday Fun Facts – 66% Off!

This just in…
For the month of April, the average price of a home in the city of Boulder was $1,247,000. This is according to the latest from our IRES MLS system.
If you want to own a home about an hour down the road in another really nice college town and get a 66% discount, you may want to check out Fort Collins 🙂
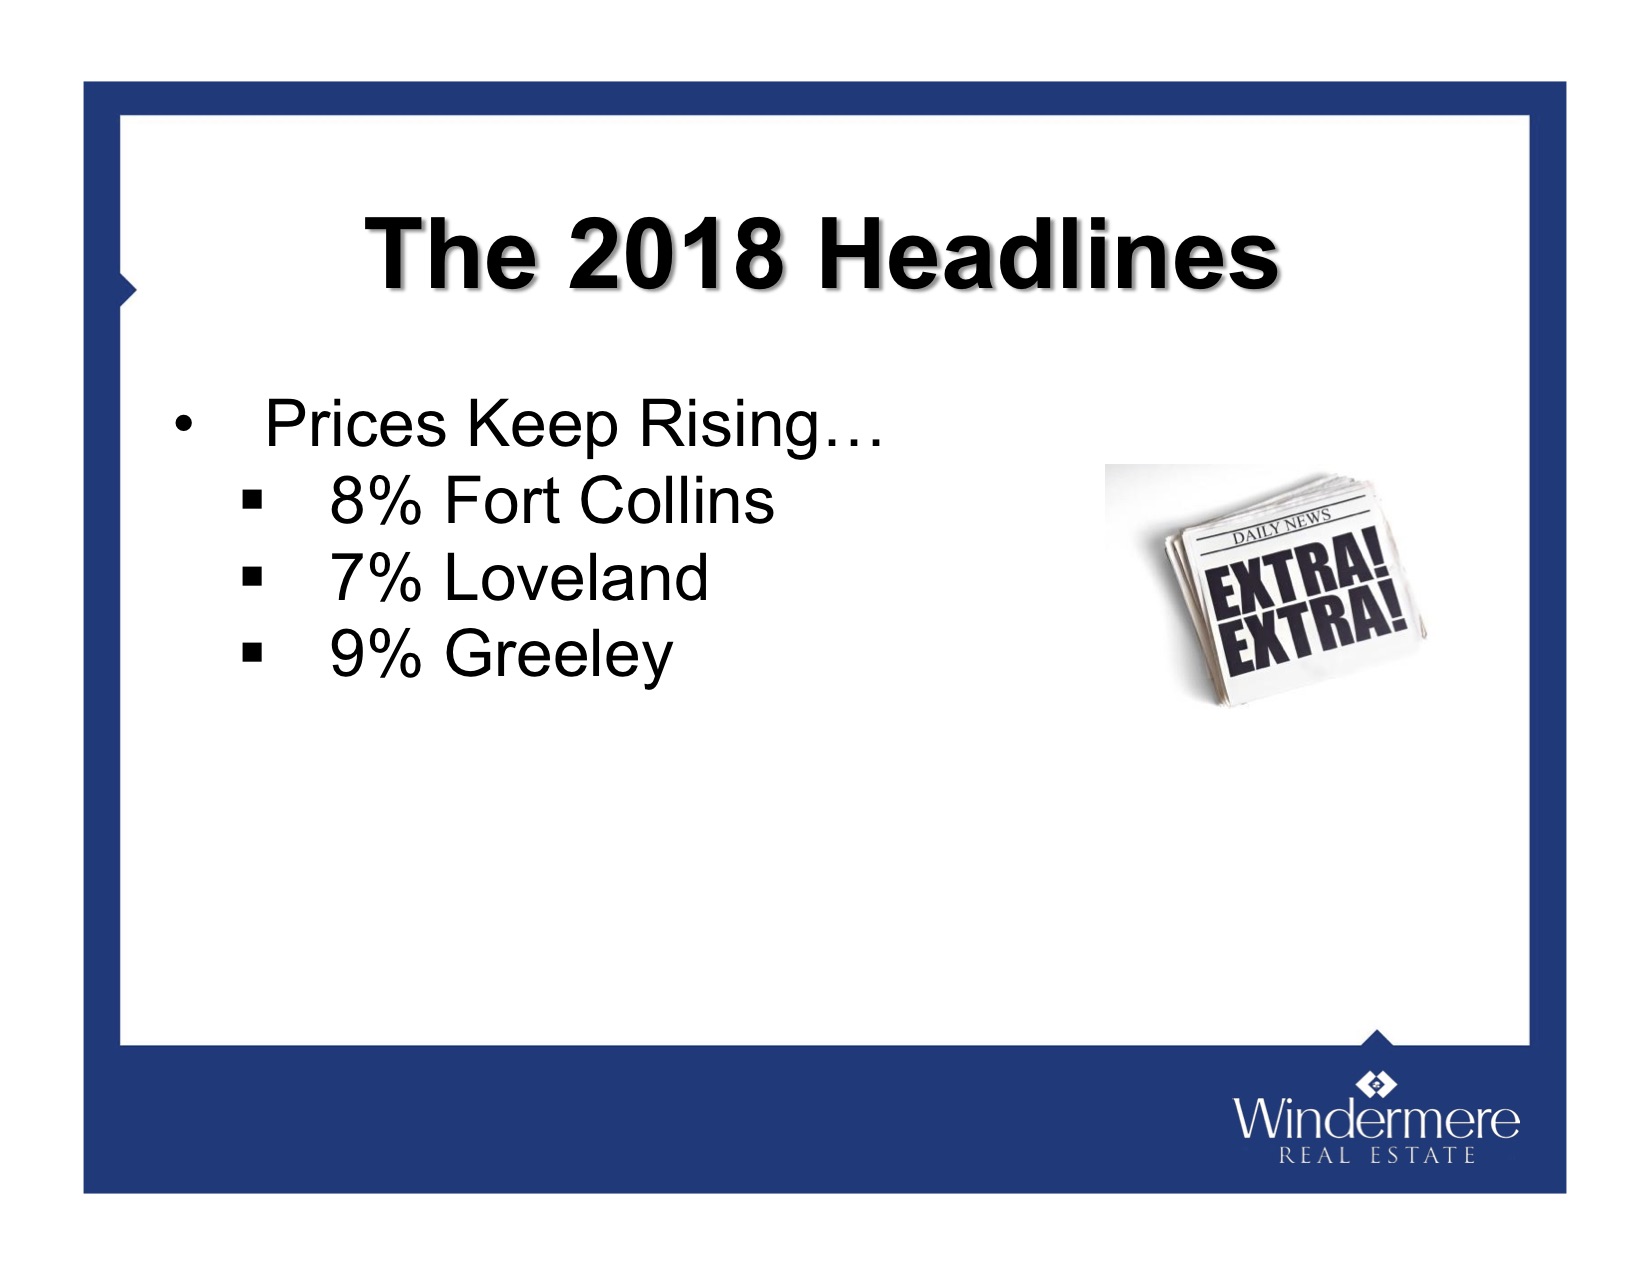
Yes, despite the recent uptick in prices here locally, we are still a bargain compared to Boulder. Here are median single-family prices for our markets and their relative price to Boulder:
- Fort Collins = $414,237 (66.8% off)
- Loveland = $360,150 (71.1% off)
- Greeley = $290,000 (76.7% off)
- Windsor = $306,450 (75.4% off)
Grab a copy of my Investment Kit so you can see the simple steps to get started without stress or complication. Email me at phunter@windermere.com and I will send you a video which clarifies the process and my Investment Checklist so you can see what to do first.
The New Gardner Report


The following analysis of the Metro Denver & Northern Colorado real estate market is provided by Windermere Real Estate Chief Economist Matthew Gardner. We hope that this information may assist you with making better-informed real estate decisions. For further information about the housing market in your area, please don’t hesitate to contact me.
ECONOMIC OVERVIEW
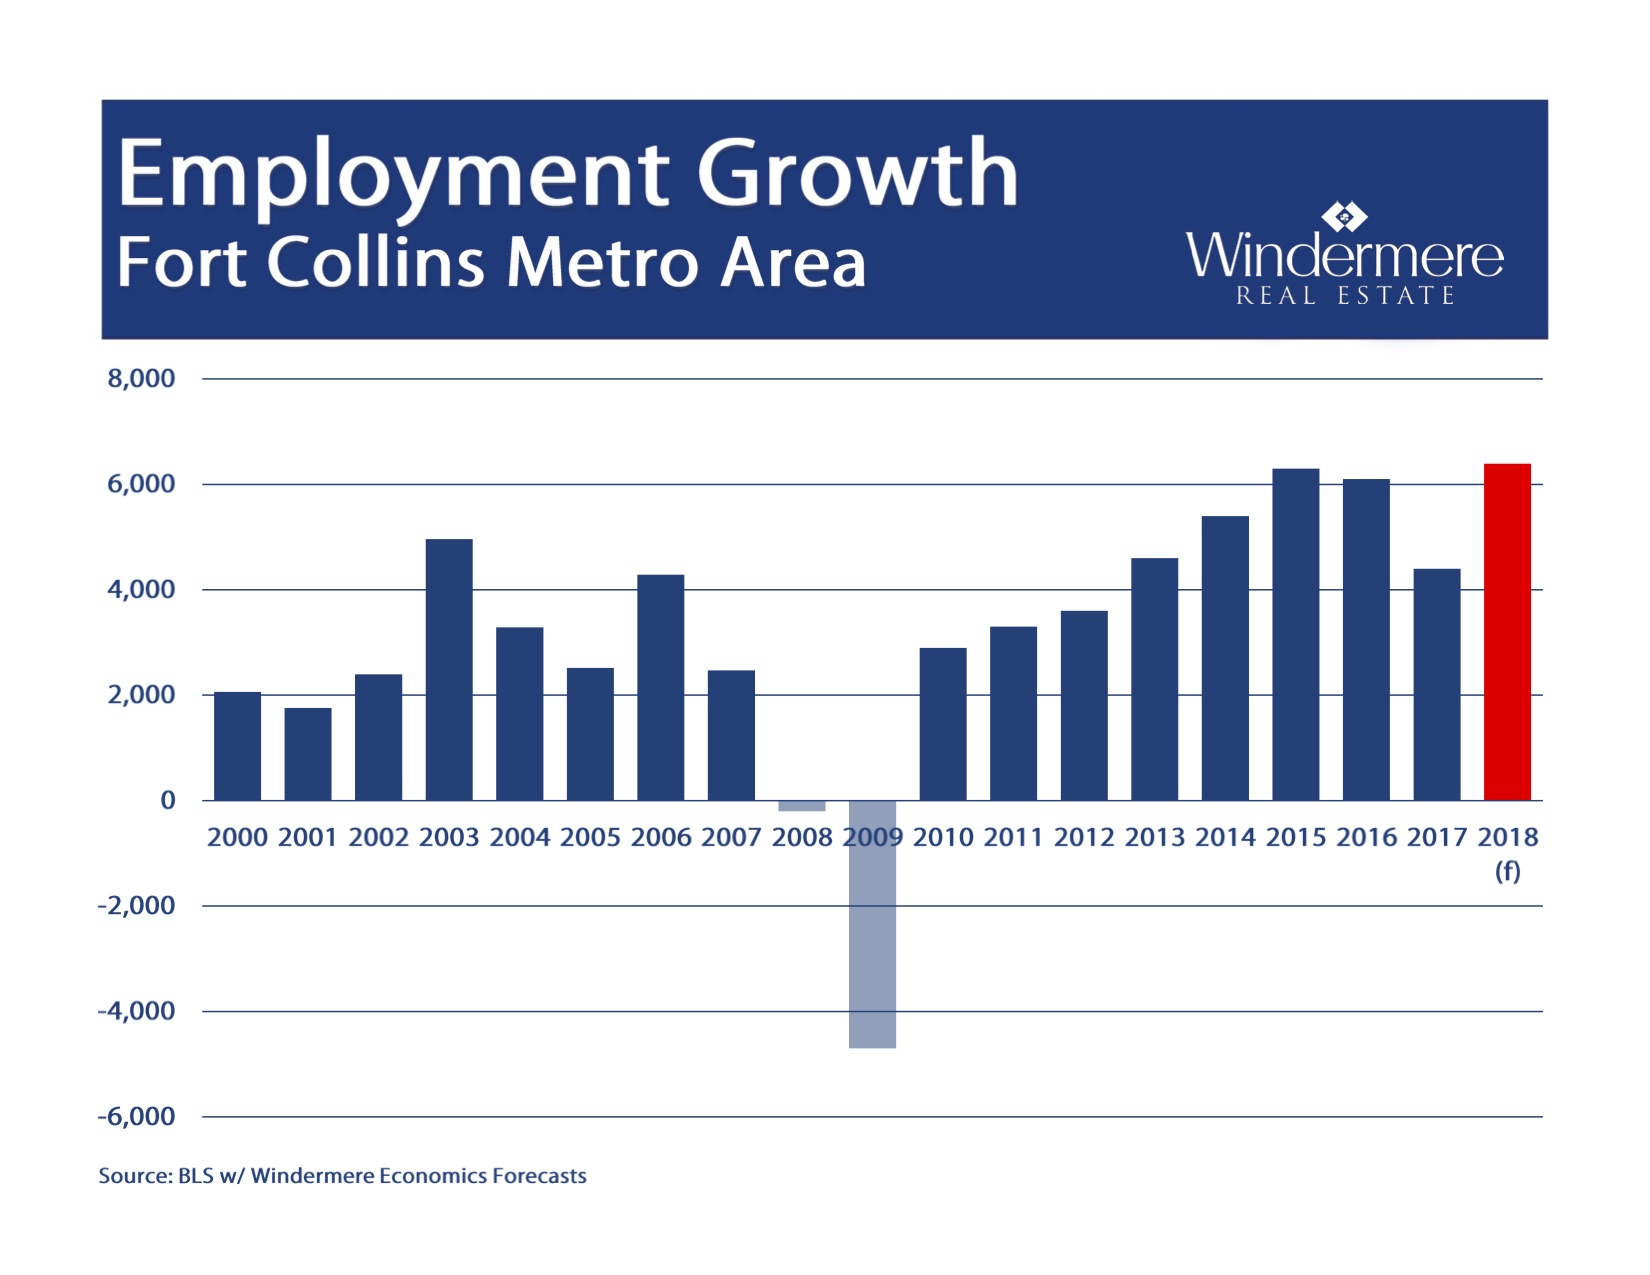
It’s good news for the state of Colorado, which saw annual employment grow in all of the metropolitan markets included in this report. The state added 63,400 non-agricultural jobs over the past 12 months, an impressive growth rate of 2.4%. Colorado has been adding an average of 5,300 new jobs per month for the past year, and I anticipate that this growth rate will continue through the balance of 2018.
In February, the unemployment rate in Colorado was 3.0%—a level that has held steady for the past six months. Unemployment has dropped in all the markets contained in this report, with the lowest reported rates in Fort Collins and Denver, where 3.1% of the labor force was actively looking for work. The highest unemployment rate was in Grand Junction, which came in at 4.6%.
HOME SALES ACTIVITY
- In the first quarter of 2018, there were 11,173 home sales—a drop of 5.6% when compared to the first quarter of 2017.
- With an increase of 5.3%, home sales rose the fastest in Boulder County, as compared to first quarter of last year. There was also a modest sales increase of 1.2% in Larimer County. Sales fell in all the other counties contained within this report.
- Home sales continue to slow due to low inventory levels, which were down 5.7% compared to a year ago.
- The takeaway here is that sales growth continues to stagnate due to the lack of homes for sale.

HOME PRICES
 Strong economic growth, combined with limited inventory, continued to push prices higher. The average home price in the markets covered by this report was up by 11.7% year-over-year to $448,687.
- Arapahoe County saw slower appreciation in home values, but the trend is still positiveand above its long-term average.
- Appreciation was strongest in Boulder County, which saw prices rise 14.8%. Almost all other counties in this report experienced solid gains.
- The ongoing imbalance between supply and demand persists and home prices continue to appreciate at above-average rates.

DAYS ON MARKET
- The average number of days it took to sell a home dropped by three days when compared to the first quarter of 2017.
- Homes in all but two counties contained in this report took less than a month to sell. Adams County continues to stand out where it took an average of just 17 days to sell a home.
- During the first quarter, it took an average of 27 days to sell a home. That rate is down 2 days from the fourth quarter of 2017.
- Housing demand remains strong and would-be buyers should expect to see stiff competition for well-positioned, well-priced homes.

CONCLUSIONS
 This speedometer reflects the state of the region’s housing market using housing inventory, price gains, home sales, interest rates, and larger economic factors. In the first quarter of 2018, I have left the needle where it was in the fourth quarter of last year. Even as interest rates trend higher, it appears as if demand will continue to outweigh supply. As we head into the spring months, I had hoped to see an increase in the number of homes for sale, but so far that has not happened. As a result, the housing market continues to heavily favor sellers.

Matthew Gardner is the Chief Economist for Windermere Real Estate, specializing in residential market analysis, commercial/industrial market analysis, financial analysis, and land use and regional economics. He is the former Principal of Gardner Economics, and has more than 30 years of professional experience both in the U.S. and U.K.
Windermere Report Monthly Highlights

This month’s Windermere Report should be arriving in your mailbox soon (if you are not already signed up to get this from me, CLICK HERE and tell me that you would like to know how the real estate market is doing each month), and I wanted to share some quick highlights.
- 48% of homes in the Fort Collins/Loveland areas are considered “affordable” to the median wage earner
- We will see 50-80% more listings hit the market March-June (yay!)
- Those homes will sell 30-50% more quickly
- We are getting BACK TO NORMAL for homeownership rates, rising back up towards a 65% rate
If these are interesting to you, I can keep you informed each month. Just DROP ME A LINE. Have a great week!
Friday Fun Facts!
|
|
|
|
|
|
|

|
|
New Downtown Loveland Hotel
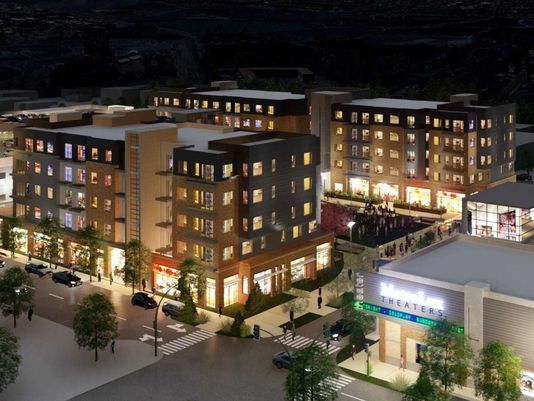
There has been A LOT of development in the Loveland and Fort Collins areas in the way of accommodations in the last few years. The Elizabeth Hotel in Fort Collins being one of the most notable. But Loveland is keeping up with its Foundry development that is a public/private partnership to bring even more life to the Downtown Loveland area.
A new hotel is being added to the mix, and it will be a 102 room Towne Place Suites by Marriott, and it will be right downtown. There will be an indoor swimming pool, meeting space, and will be pet friendly. Now people will be able to look at Downtown Loveland as a destination, with shopping, restaurants and hotels all within walking distance of each other.
If you have any questions about this hotel or the Foundry development in Loveland, give me a call!
The Gardner Report

Every quarter Windermere’s Economist Matthew Gardner puts out the Gardner Report. Check out the lates installment of this report for Northern Colorado below!
Are We Bubbly?
Because our Northern Colorado market has been so active over the last four years, clients often ask me if wIe think there is a housing bubble forming.
There are several key statistics which we track closely in order to answer that question.
Here is one fact that we find to be insightful…
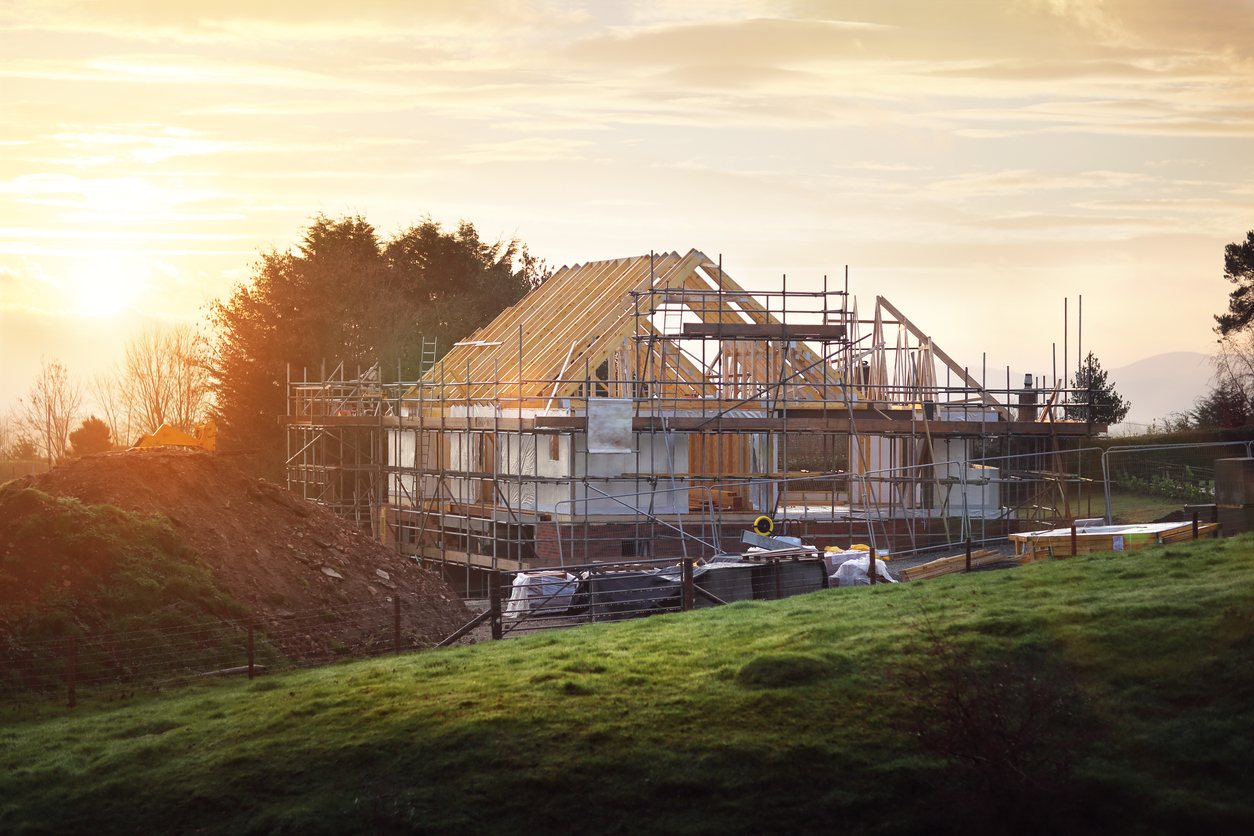
One of the root causes of the last housing bubble was the glut of inventory, and specifically new home inventory. Quite simply, the market was being oversupplied with new homes. The rules of economics say when there is oversupply, prices must come down.

Today, there are far fewer new home starts compared to 2004 and 2005 when the last bubble was forming – despite there being a larger population.
According to our friends at Metrostudy who track the new home market, Northern Colorado has had 4,452 new home starts in the last 12 months.
That number is only 60% of what it was at the height of construction in early 2005.
It is also interesting to note that over the last 12 months there have been 4,473 new home closings which shows that demand is keeping up with supply.
So when you drive around Northern Colorado and notice all the new homes being built, know that construction activity is far less than what is was during the bubble and that demand is keeping up with supply.
In case you missed our annual real estate Forecast event, you can reach out to me to see the presentation slides or receive a video recap of the information. Just email me at phunter@windermere.com
Windermere Market Forecast

I want to thank everyone that was able to make it to our Market Forecast last week, we all really appreciate it! If you would like to get the powerpoint presentation or would like a rundown from the event, please give me a call or shoot me an email. Or if you would like to know more about the market activity in your neighborhood or the value of your home specifically, let me buy you lunch and we can talk more about it!