Buyer TipsFriday Fun FactsHomes for SaleInvestmentReal EstateSeller Tips March 13, 2020

Headwind Vs. Tailwind

Headwind vs. Tailwind

So far the tailwind of historically-low mortgage rates are prevailing over Wall Street and COVID-19 concerns.

Buyers are still active. Properties are still closing. Moving trucks are still showing up at people’s homes.

Open house traffic has declined, but we notice plenty of buyers looking for property. (one of our open houses last weekend had over 40 visitors)

For many, the interest rates are just too good to pass up.

We even see instances of multiple-offer situations for properties priced right in high-demand locations.

Rates today, compared to 4%, equate to not only a monthly savings for those refinancing but also equates to tens of thousands in additional purchase power.

For the average price of a home on the Front Range, the savings is $171 per month and the increased purchase power is $35,811.

Here’s what we expect to happen over the coming months. Listing inventory and transaction volume will both decline. We will no doubt see lower activity compared to a year ago.

But thoughts of the market “coming to a screeching halt” can’t be validated because of the historical performance of our market and because of the inherent fundamentals in place.

We will continue to track the numbers and communicate the facts so that you remain well-informed.

Buyer TipsFriday Fun FactsHomes for SaleInvestmentReal EstateSeller Tips March 6, 2020

A History Lesson

With the stock market on a wild ride and the Dow Jones dropping nearly 1,000 points yesterday, it makes some people wonder if the local real estate market might also crash or at least “correct.”

A little history lesson is in order.

Over the last 40 years, the real estate market along the Front Range has averaged 5.5% appreciation per year.

The highest appreciation in one year was 15.9% in 1994.

The lowest ever was -4.0% in 1982.

The last time Wall Street was in turmoil and the stock market was plummeting was 2008.  This was, for many reasons, the worst economy of our lifetime.

That year real estate along the Front Range dropped 2.2%.

Meanwhile that year the Dow Jones fell 33.8%.

Bottom line, our market has no history of crashing or even experiencing a major correction.

Why is that?

The answer is fundamentals.

Our local economy has inherent fundamentals that insulate it from big downturns.

We have an incredibly diverse economy which is not reliant upon a single industry.  We have all the way from health care, to technology, agriculture, oil and gas, major universities, and financial services (just to name a few).

We are a global destination with a major international airport.

Oh, and the quality of life here isn’t too shabby.

Prices of real estate, just like prices of anything, come down to basic economic principles of supply and demand.

Because of our diverse economy and desirable quality of life, there has been strong, consistent demand for housing along the Front Range.

While there may be little bumps along the way, over the long term our market has proven that it performs.


About the areaBuyer TipsEvans Real EstateFort Collins Real EstateHomes for SaleInvestmentLoveland Real EstateReal EstateSeller TipsWellington Real EstateWindsor Real Estate February 11, 2019

How’s 2019?

How’s 2019?

A lot of my clients are asking how 2019 is starting off.

Here’s one thing we notice…

There are more homes to choose from, which is great news for buyers.

In January alone 4,821 homes came on the market in Metro Denver.

That is a 14% increase compared to one year ago.

At our annual Market Forecast, we predicted a more balanced market in 2019, so far it looks like we are trending that way.

If you would like to see a short video with a recap of our annual Market Forecast presentation, click the image below.


About the areaBuyer TipsFort Collins Real EstateHomes for SaleInvestmentReal EstateSeller Tips September 10, 2018

Fort Collins Real Estate: Dual Markets

You may hear how the market is still blazing fast and homes are selling in just days, and you may hear that the market is slowing down and it is becoming more normalized. Here’s the truth……both of those statements are true! We essentially have a tale of two markets in Fort Collins, the one under $500,000 and the one over $500,000. Check out the graph below to see how quickly homes are selling in the market UNDER $500,000.

Under $500k

Now check out what the average days on market over $500,000 in Fort Collins looks like, quite the difference!

Over $500k

This is NOT terrible news for the over $500,000 market by the way. Now more than ever it is important to stand out from the crowd if you have a more expensive home, and our Windermere Premier Certified Listing program can help you feel like you are still in the super hot market of this past spring.

If you ever have any questions for me, please don’t hesitate to give me a ring or shoot me an email. Have a great week!

About the areaBuyer TipsFort Collins Real EstateHomes for SaleInvestmentLoveland Real EstateReal EstateSeller TipsWellington Real EstateWindsor Real Estate August 3, 2018

New Gardner Report

Colorado Real Estate Market Update

ECONOMIC OVERVIEW

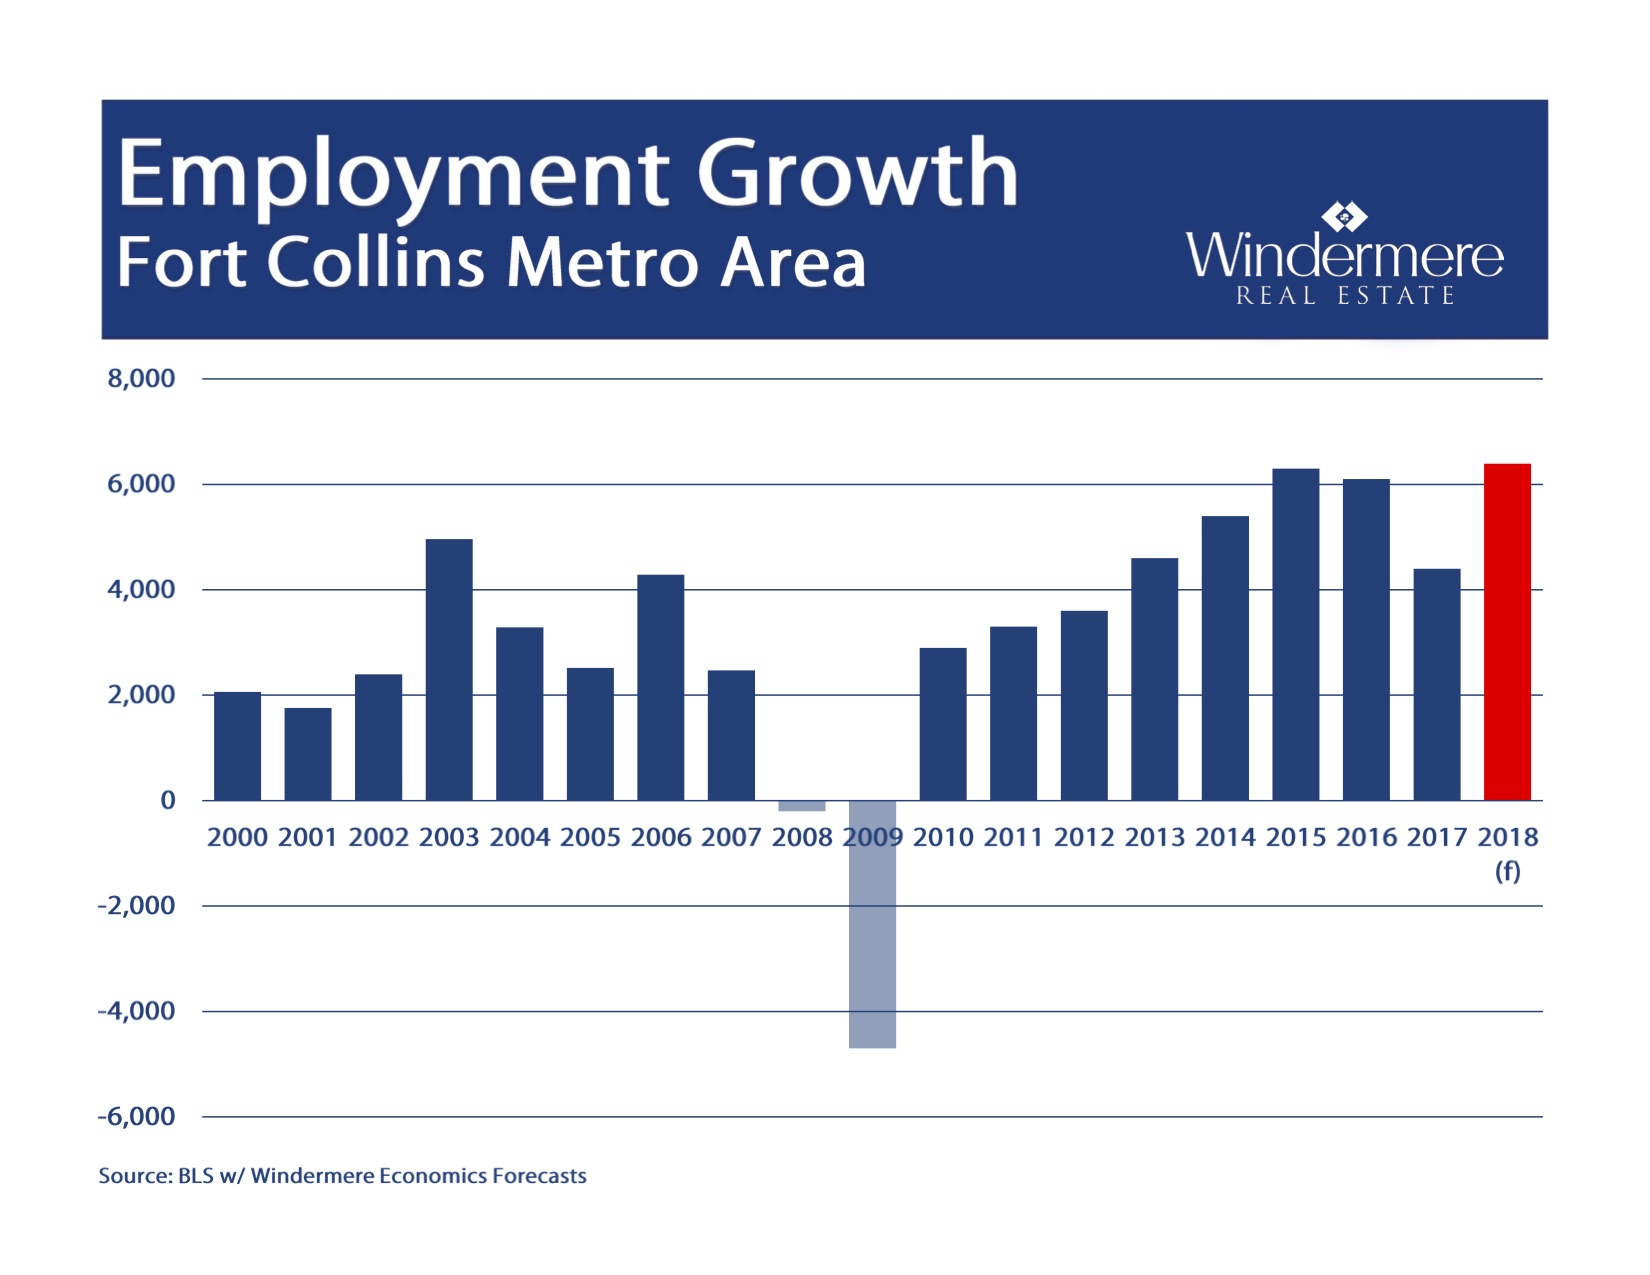
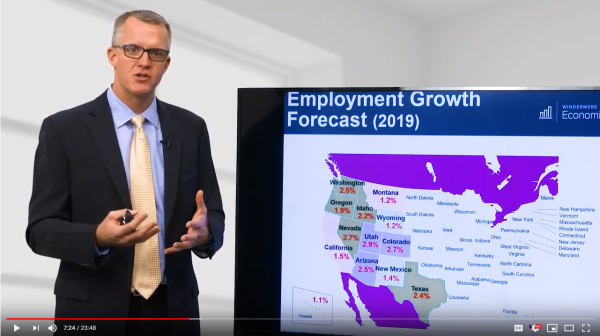
Colorado continues to see very strong job growth, adding 72,800 non-agricultural jobs over the past 12 months—an impressive increase of 2.7%. Through the first five months of 2018, the state added an average of 7,300 new jobs per month. I expect this growth to continue through the remainder of the year, resulting in about 80,000 new jobs in 2018.

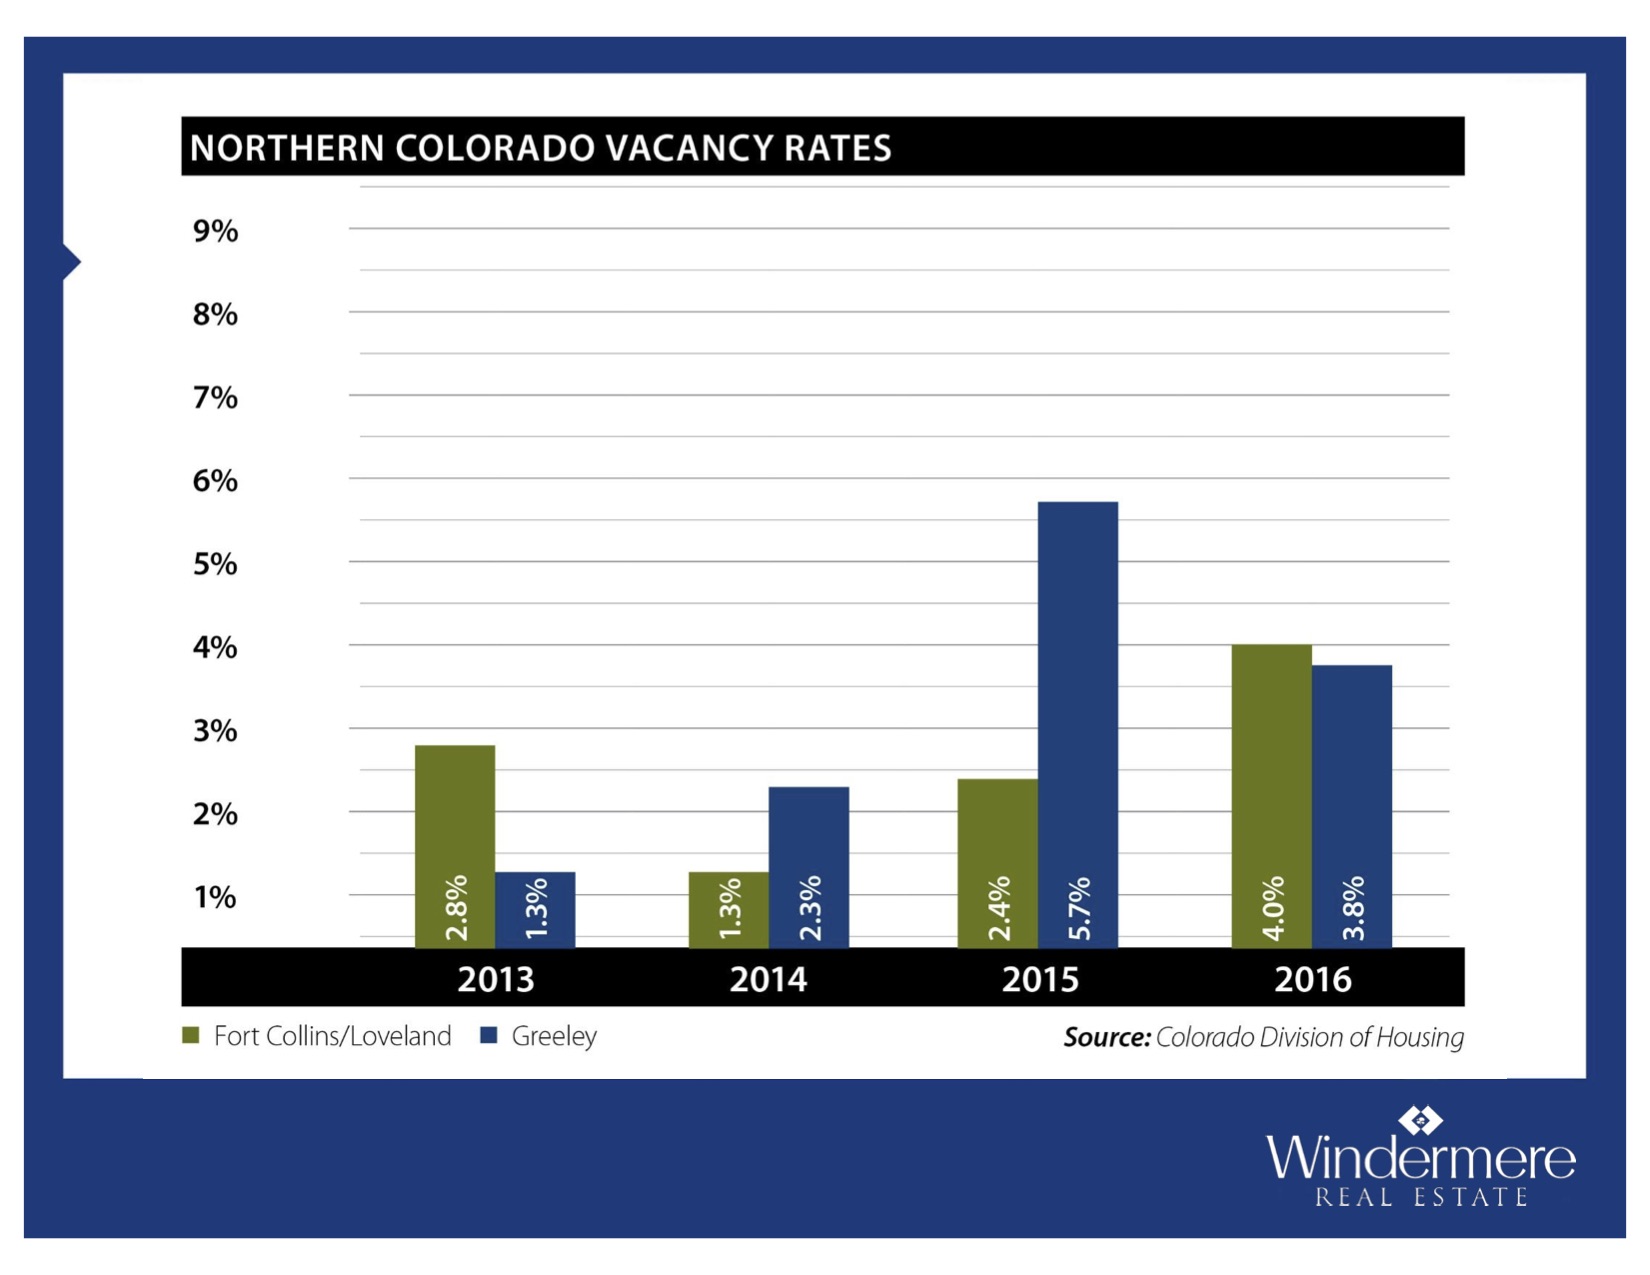
In May, the state unemployment rate was 2.8%. This is slightly above the 2.6% we saw a year ago but still represents a remarkably low level. Unemployment remains either stable or is dropping in all the markets contained in this report, with the lowest reported rates in Fort Collins and Boulder, where just 2.2% of the labor force was actively looking for work. The highest unemployment rate was in Grand Junction, which came in at 3.1%.


HOME SALES ACTIVITY

  • In the second quarter of 2018, 17,769 homes sold—a drop of 2.4% compared to the second quarter of 2017.
  • Sales rose in 5 of the 11 counties contained in this report, with Gilpin County sales rising by an impressive 10.7% compared to second quarter of last year. There were also noticeable increases in Clear Creek and Weld Counties. Sales fell the most in Park County but, as this is a relatively small area, I see no great cause for concern at this time.
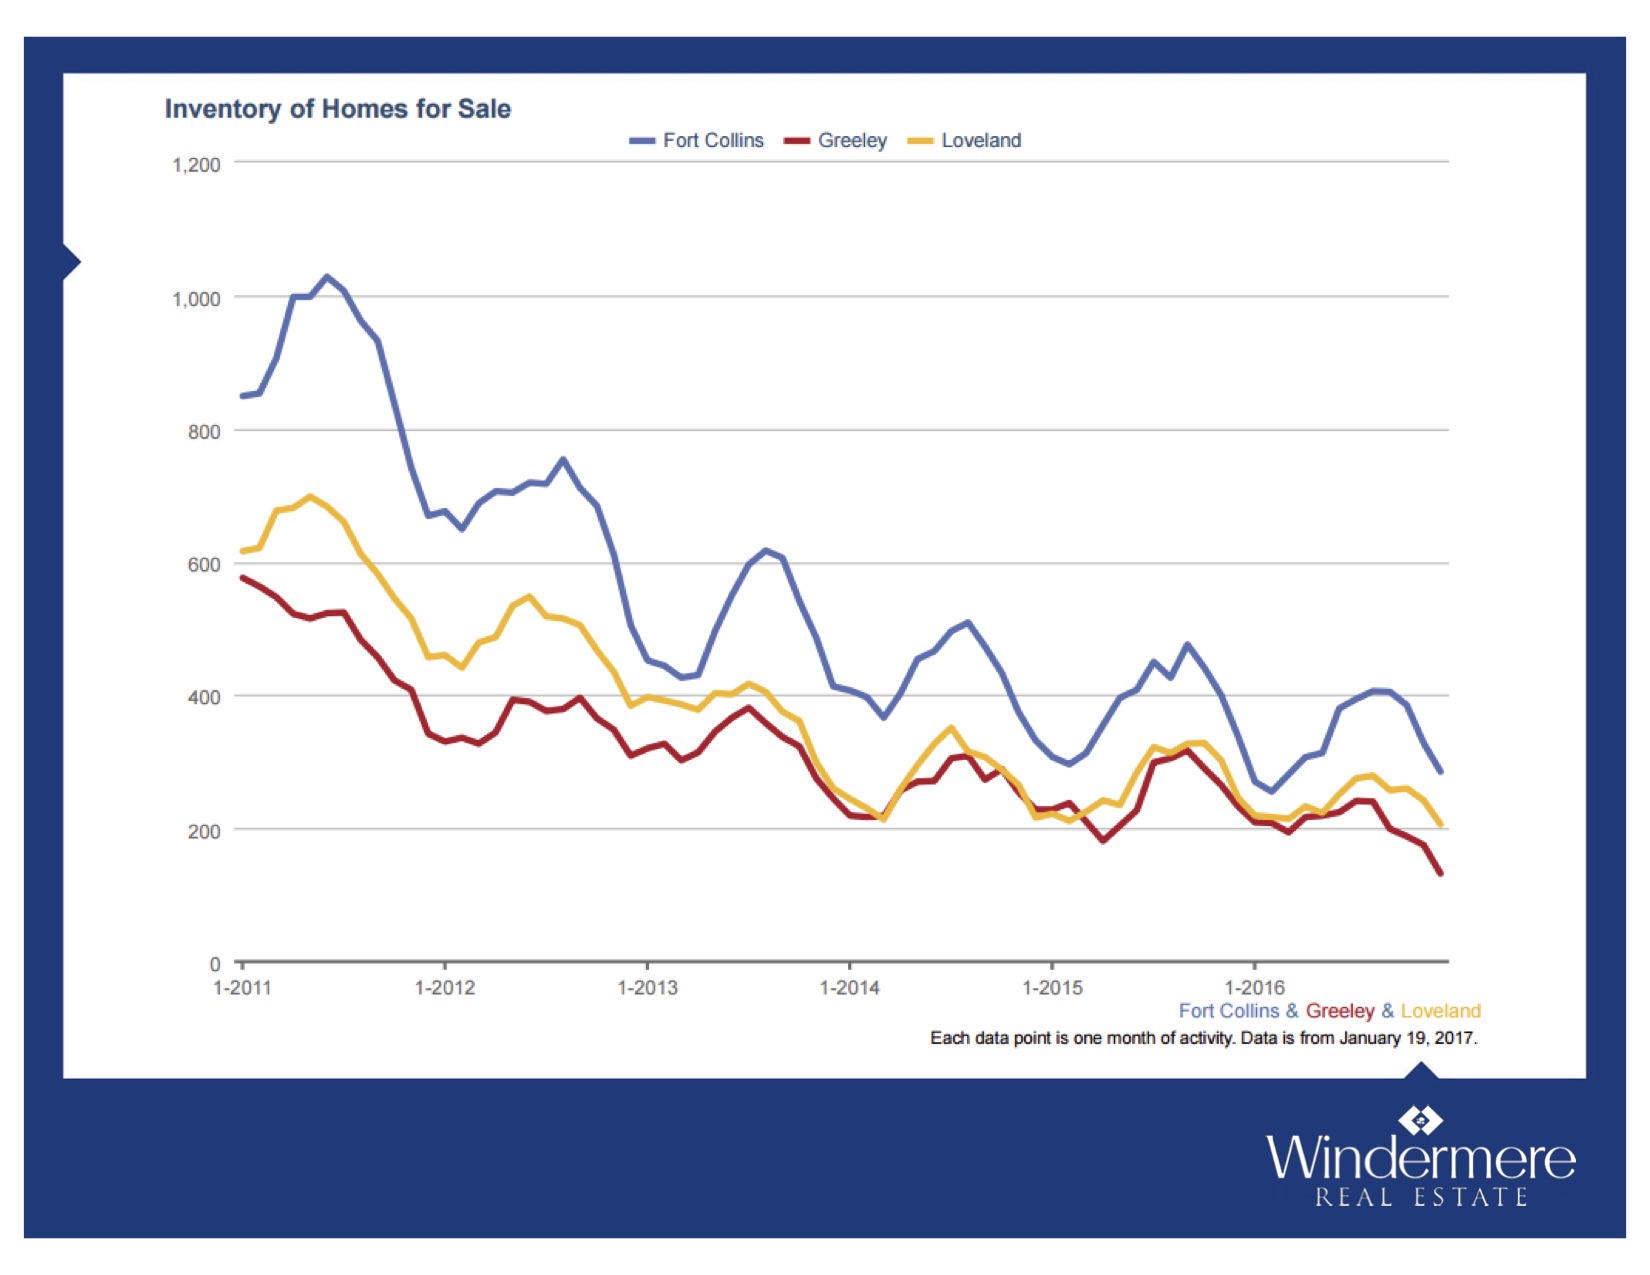
  • Slowing sales activity is to be expected given the low levels of available homes for sale in many of the counties contained in this report. That said, we did see some significant increases in listing activity in Denver and Larimer Counties. This should translate into increasing sales through the summer months.
  • The takeaway here is that sales growth is being hobbled by a general lack of homes for sale, and due to a drop in housing demand.


HOME PRICES

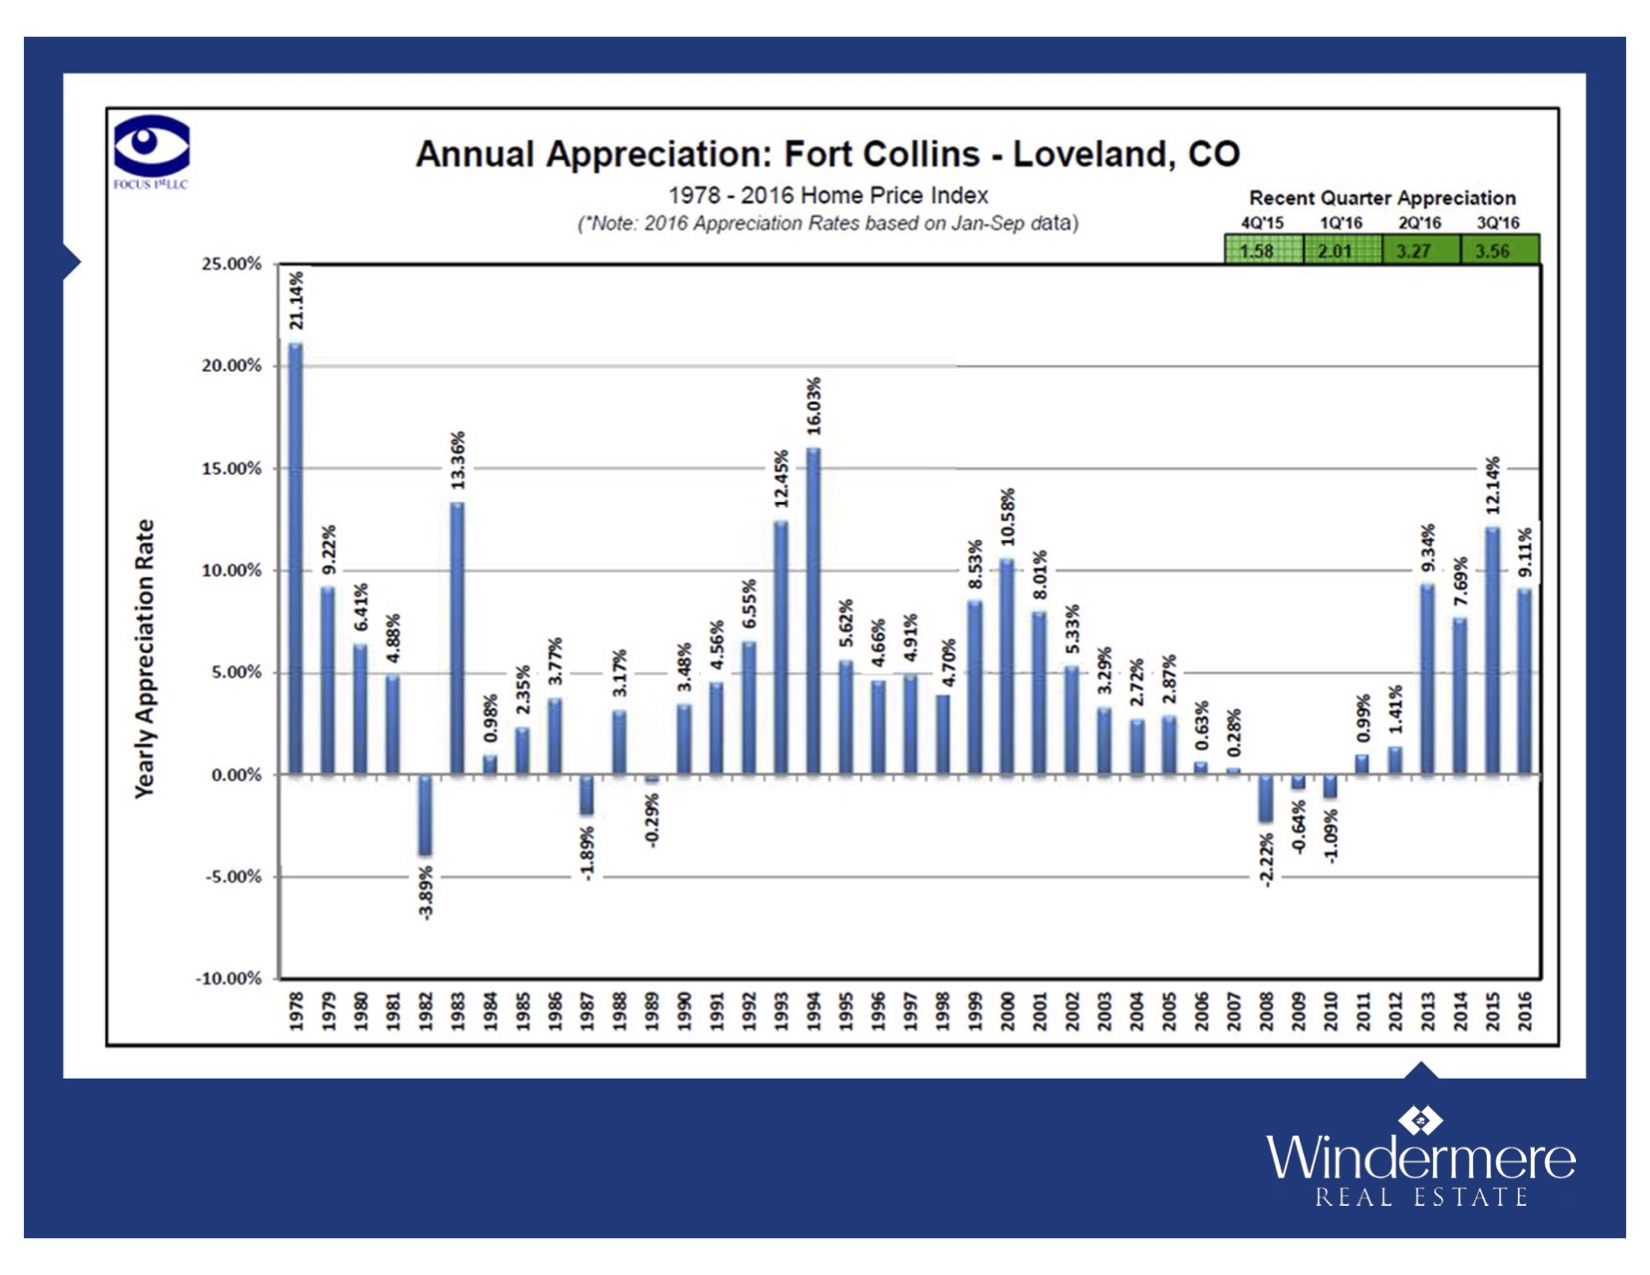
  • With strong economic growth and a persistent lack of inventory, prices continue to trend higher. The average home price in the region rose
    9.8% year-over-year to $479,943.
  • The smallest price gains in the region were in Park County, though the increase there was still a respectable 7%.
  • Appreciation was strongest in Clear Creek and Gilpin Counties, where prices rose by 28.9% and 26%, respectively. All other counties in this report saw gains above the long-term average.
  • Although there was some growth in listings, the ongoing imbalance between supply and demand persists, driving home prices higher.


DAYS ON MARKET

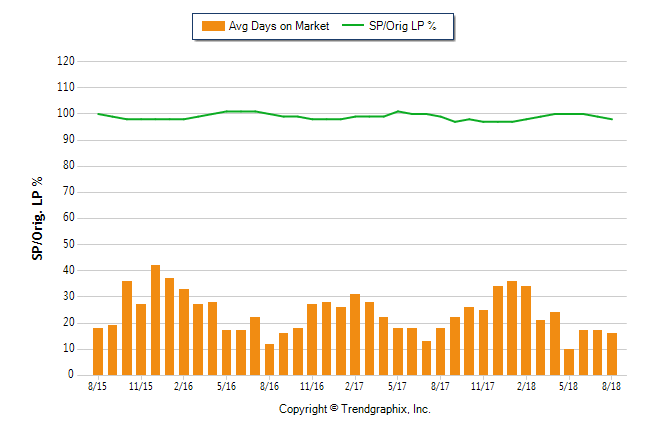
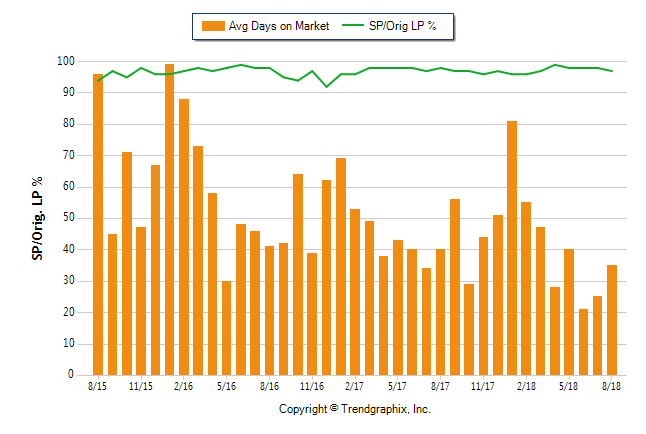
  • The average number of days it took to sell a home remained at the same level as a year ago.
  • The length of time it took to sell a home dropped in most markets contained in this report. Gilpin County saw a very significant jump in days on market, but this can be attributed to the fact that it is a very small area which makes it prone to severe swings.
  • In the second quarter of 2018, it took an average of 24 days to sell a home. Of note is Adams County, where it took an average of only 10 days to sell a home.
  • Housing demand remains very strong and all the markets in this report continue to be in dire need of additional inventory to satisfy demand.


CONCLUSIONS

This speedometer reflects the state of the region’s real estate market using housing inventory, price gains, home sales, interest rates, and larger economic factors.

For the second quarter of 2018, I have moved the needle very slightly towards buyers as a few counties actually saw inventories rise. However, while I expect to see listings increase in the coming months, for now, the housing market continues to heavily favor sellers.


Matthew Gardner is the Chief Economist for Windermere Real Estate, specializing in residential market analysis, commercial/industrial market analysis, financial analysis, and land use and regional economics. He is the former Principal of Gardner Economics, and has more than 30 years of professional experience both in the U.S. and U.K.


About the areaBuyer TipsFort Collins Real EstateHomes for SaleInvestmentLoveland Real EstateReal EstateSeller TipsWellington Real EstateWindsor Real Estate March 23, 2018

Friday Fun Facts!

image

Top 4/Bottom 4

At the end of this weekend College Basketball’s Final 4 will be established. It might make you wonder, what the top 4 and bottom 4 real estate markets across the country?

Here they are, ranked by the last 12 months of appreciation according to fhfa.gov:

Top 4:

  1. Tacoma, WA 14.6%
  2. Seattle, WA 14.3%
  3. Port St. Lucie, FL 13.7%
  4. Las Vegas, NV 13.6%

Bottom 4:

  1. Atlantic, NJ -3.14%
  2. Peoria, IL -3.0%
  3. Huntington, WV -2.6%
  4. Jackson, MS -1.2%

Welcome to Friday Fun Facts!

Thanks for checking out this week’s Friday Fun Facts!

These little nuggets of information are designed to inform, education and entertain you. I promise to give you some solid takeaways, based on real life with information that will keep you up-to-date. CONTACT ME FOR MORE MARKET INFO

About the areaBuyer TipsFort Collins Real EstateInvestmentLoveland Real EstateReal EstateSeller TipsWellington Real EstateWindsor Real Estate February 9, 2018

Friday Fun Facts!

image

The Antidote

The stock market is in turmoil this week (I’m guessing that you’ve noticed). Investors feel like they’re strapped into a roller coaster at Coney Island- up and down and all around they go, thrashed around by the whims of the market.

These are words currently on financial news websites: Whiplash, Volatile, Wild Ride, Plunge!

But, here’s the deal. While the Dow Jones plummeted 4.2% yesterday (in one day!?), real estate in Northern Colorado did not.

Real Estate is the antidote for stock market heartburn.

Consider the numbers:

  • Over the last 40 years, Northern Colorado real estate prices have averaged a 5.36% increase per year.
  • The last 10 years have seen a 4.99% increase per year.
  • It took the worst economy of our lifetime in 2008 to cause prices to go down only 2.2%. (massive banks were going out of business on Wall Street and real estate prices here went down 2.2%!)
  • Our NoCo population is growing by about 13,000 per year and those people need a place to live.

If you’re looking for a predictable, tangible, calming, help-you-sleep-at-night, easy-to-understand place to put your money, real estate just might be for you!

As it turns out, I can help you with that 🙂

Now, here’s how the current events on Wall Street have a very relevant impact on real estate- interest rates.

If you attended our Market Forecast you saw how the 30-year mortgage rate has a direct correlation to the 10-year treasury note.

Rates on the 10-year note are up over a half of a percent in just a few weeks. We have seen mortgage rates go up recently and they will continue to go up.

We believe this may slow the rate of home price appreciation (this doesn’t mean ‘go down’, it means the pace of appreciation will slow).

As mentioned above, the long-term appreciation has been near 5% per year. Lately it’s been near 8%. Rising rates could cause the prices to go back to their more normal appreciation rate.

So, even if your stock market portfolio is taking a wild ride, sleep well knowing your real estate continues to perform.

Just released – a video recap of our annual Market Forecast. It will help clarify everything happening in Northern Colorado real estate.

Watch Here.

About the areaBuyer TipsFort Collins Real EstateInvestmentLoveland Real EstateReal EstateSeller TipsWellington Real EstateWindsor Real Estate January 21, 2018

Windermere Market Forecast

I want to thank everyone that was able to make it to our Market Forecast last week, we all really appreciate it! If you would like to get the powerpoint presentation or would like a rundown from the event, please give me a call or shoot me an email. Or if you would like to know more about the market activity in your neighborhood or the value of your home specifically, let me buy you lunch and we can talk more about it!


About the areaBuyer TipsInvestmentReal EstateSeller Tips March 4, 2017

What’s Happening In The 2017 NoCo Real Estate Market?

Have you asked yourself this question, or has someone you know asked this question? Then let us answer! Check out the video below that outlines our 2017 Windermere Real Estate Market Forecast!

About the areaBuyer TipsInvestmentReal EstateSeller Tips January 23, 2017

What’s Happening In The 2017 Real Estate Market?

I want to thank everyone who came out to the Windermere Forecast last week, it was great to see so many people there interested in the real estate market and where we are headed in the future. I wanted to make sure that even if you did not make it, you are familiar with some of the big takeaways from the presentation.

The big story of course is the ongoing low inventory in Northern Colorado. We are at a quarter of where we were back just 6 years ago in 2011, just check out the graph below. This will continue to drive a fast moving market through 2017, although potentially not at the same pace we saw in 2016. That cooling off will be a product of increasing interest rates as the year progresses. While it is certainly great to be a seller in this market, there are still great ways for buyers to get more home than they could have afforded in the past because of where interest rates are currently.

What that low inventory has driven is an above average appreciation rate for the Fort Collins/Loveland areas (as well as the rest of Northern Colorado). As you can see below, we are above the long term 5% appreciation average, so again that will probably slow down just a little bit in to 2017, although we will still be appreciating!

One of the other big questions I get is from my investors, and that is “why should I buy an investment property with these increased prices?”. The answer lies in two things. The first is low interest rates, and the second is with massively increased rents. Even when a 3 bedroom 2 bath home near the CSU campus was $100,000 less than it was today, we are STILL cash flowing about 60% more than we were back when prices were lower. As you can see below, we have seen an increase in rents, along with a decrease in vacancy (especially if you look at a longer 10 year term).

If you have any questions about this info, or want to talk more about buying, selling, or investing in real estate, I’d love to take you to coffee to discuss it!