
 Facebook
 Twitter
 Pinterest
 Copy Link
Forbearance Falls
The number of loans in forbearance just fell to their lowest level since mid-April.
This is good news for the real estate market.
Less and less people are seeking payment relief on their mortgages.
The number of loans currently in forbearance stands at 7.16%.
This news coincides with the U.S. Unemployment Rate falling to it’s lowest level in 5 months as more people are getting their jobs back.
The economy has added back roughly half of the 22.2 million jobs that were lost in March and April of this year.
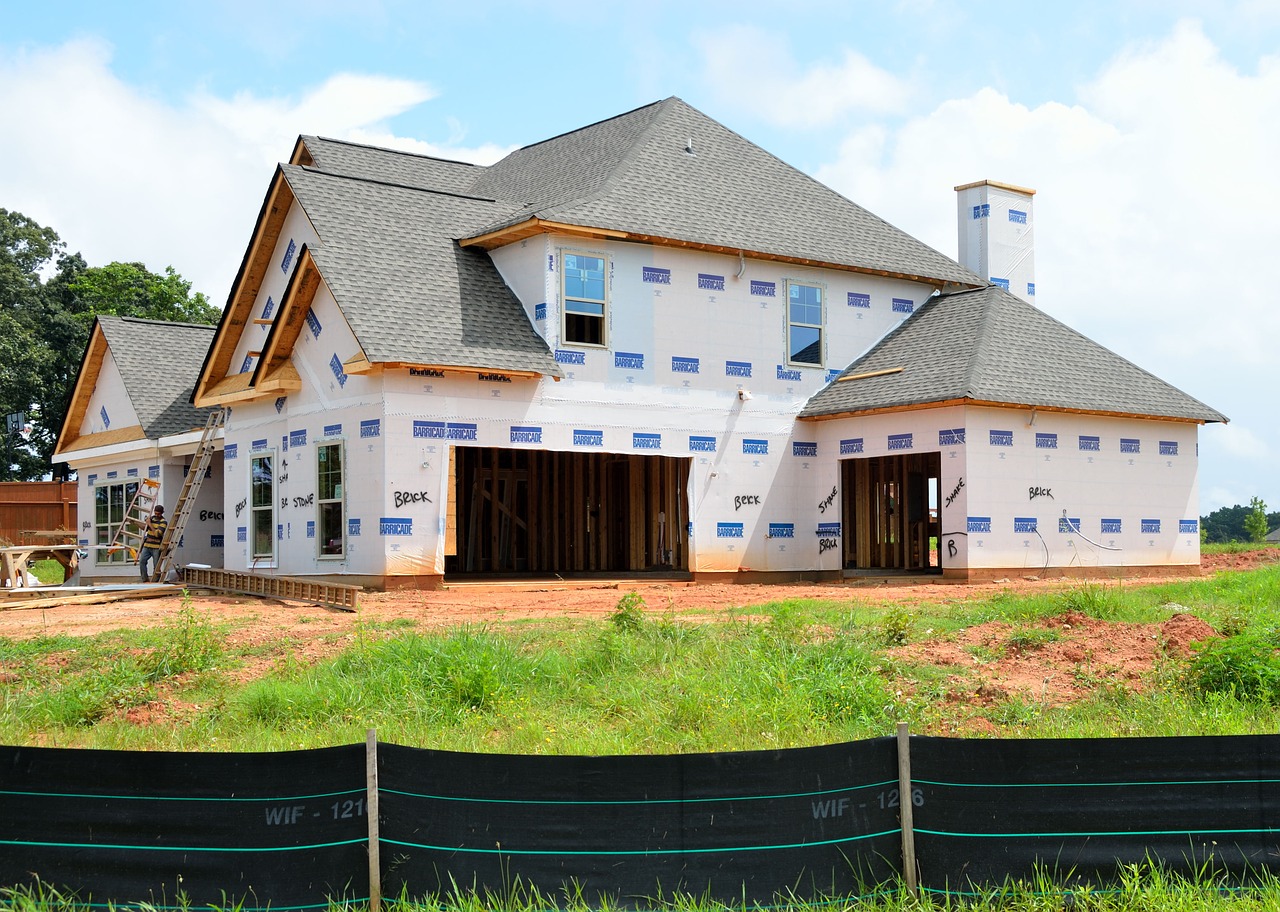
New Home Surge
Sales of new homes have jumped to their highest levels in 14 years.
The annualized rate of single-family new construction homes is now at 901,000 according to the new Census Bureau report.
This means that across the U.S., at the current pace of sales, there will be almost 1,000,000 new homes built and sold over the next 12 months.
This pace is 36% higher than one year ago and the highest it has been since the end of 2006.
Given the low inventory levels of previously-owned homes that most of the Country is experiencing, this uptick in new home activity is welcome news.
Price Report

The Federal Housing Finance Authority just released their most recent quarterly report which tracks home price appreciation in the top 100 metropolitan areas in the U.S. plus appreciation in individual states.
Some significant findings from the report:
House prices have risen for 36 consecutive quarters, or since September 2011.
House prices rose in all 50 states and the District of Columbia between the second quarters of 2019 and 2020.
The top five areas for annual appreciation were:
1) Idaho 10.8%
2) Arizona 9.1%
3) Washington 8.6%
4) Utah 8.1%
5) New Mexico 7.7%.
Idaho has been the leading state for the last 7 quarters.
Colorado showed annual appreciation of 4.4%.
The areas showing the lowest annual appreciation were:
1) West Virginia 1.1%
2) North Dakota 1.1%
3) District of Columbia 1.4%
4) Illinois 2.5%
5) Alaska 2.6%.
House prices rose in 99 of the top 100 largest metropolitan areas in the U.S. over the last four quarters.
Annual price increases were greatest in Honolulu, HI, where prices increased by 11.7%.
Prices were weakest in San Francisco, where they decreased by 0.3%.
At Windermere Real Estate we are taking Safer at Home and Social Distancing very seriously. Our people are following our Safe Showings protocol, staying connected to their clients, and providing help wherever needed.
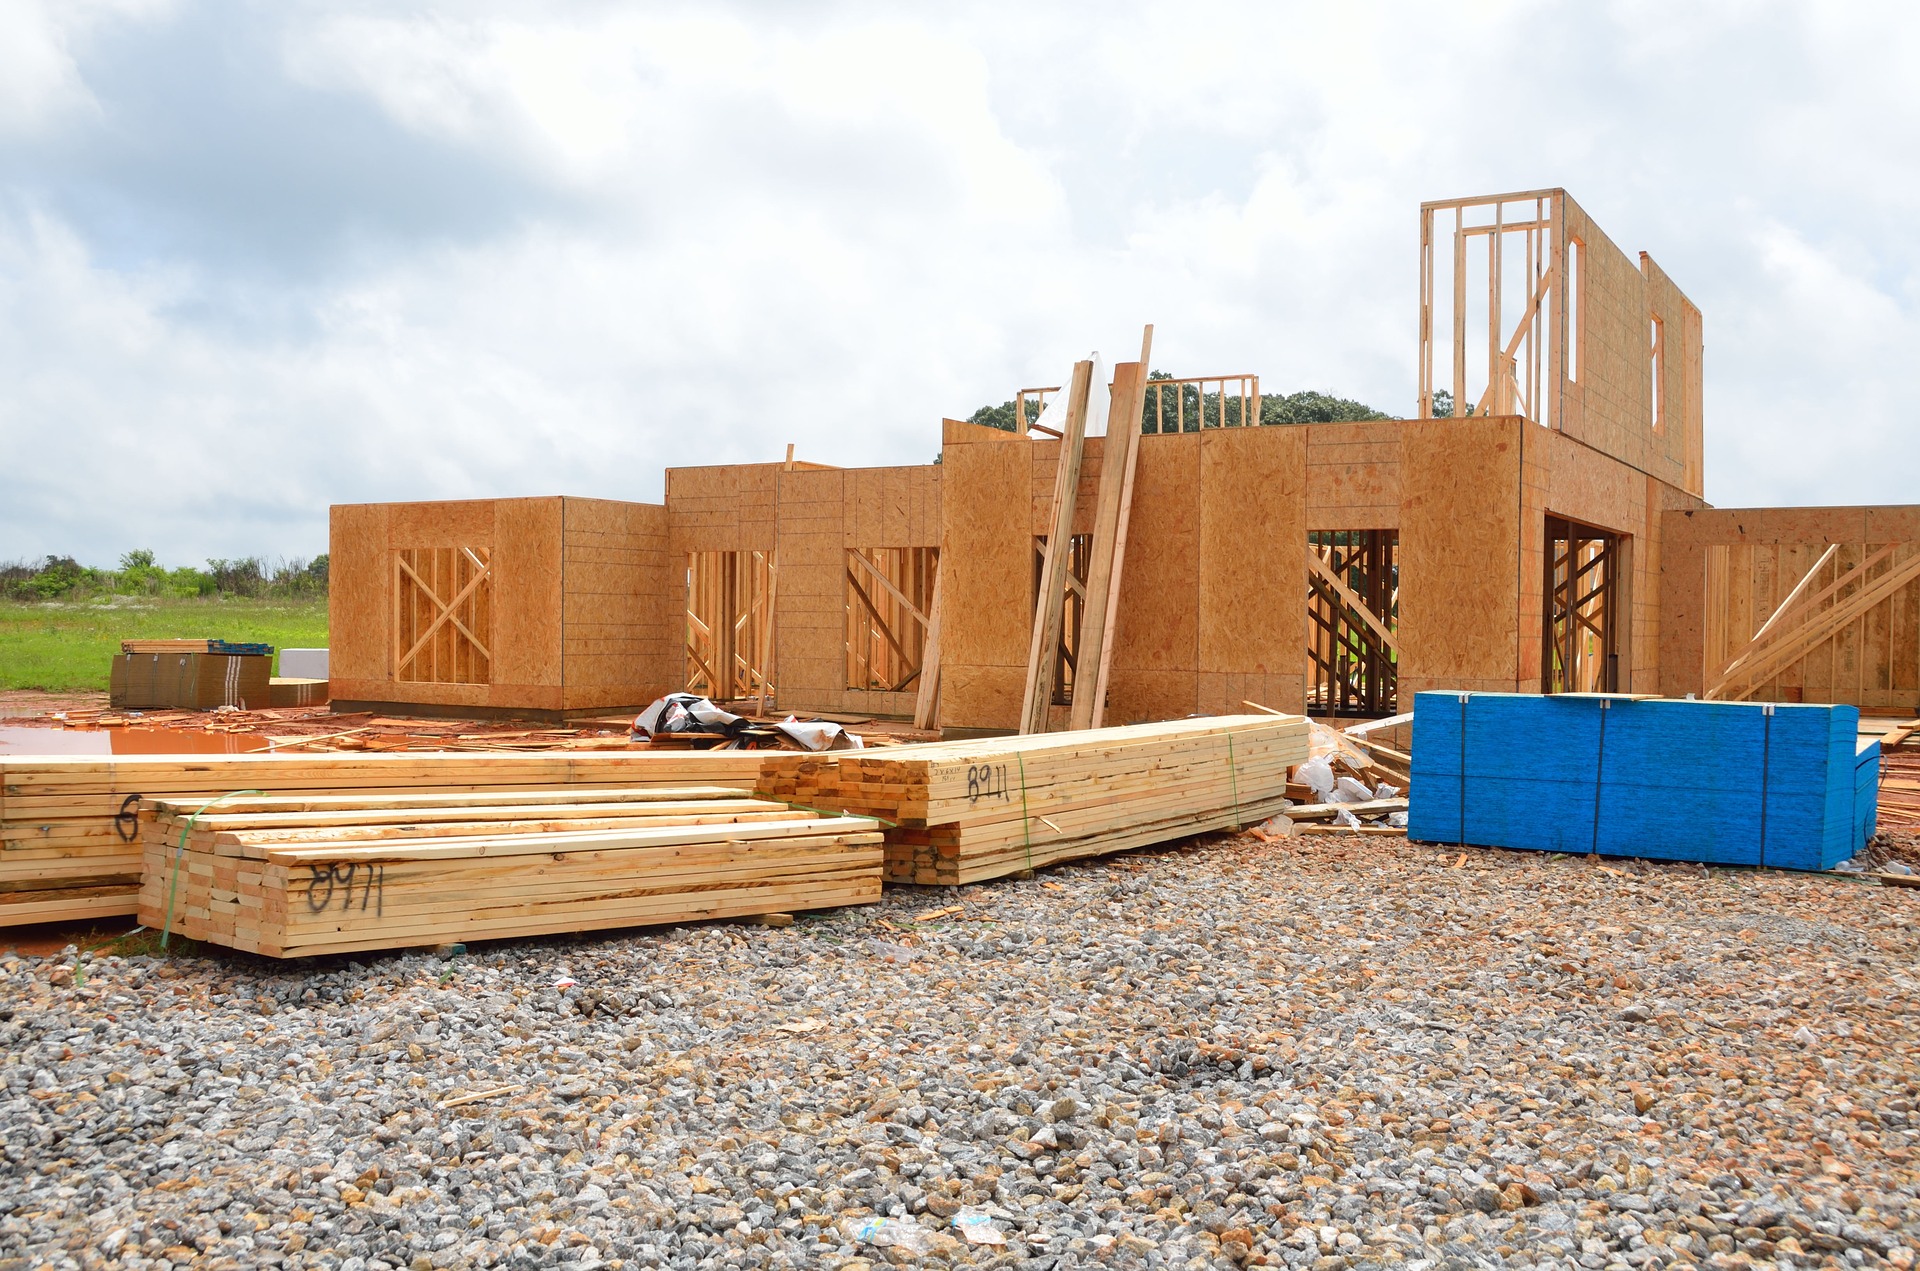
Start it UP!
Start it Up
As further evidence that the housing market is more than alive and well, new home starts have recently jumped across the U.S.
Building of residential properties is up 23.4% compared to last year and up 22.6% from last month.
Pre-pandemic demand for new homes was very high. Now, record-low interest rates are fueling the market to new highs.
At Least List

Periodically we track a stat which we find to be quite interesting.
It answers this question – how many properties are selling for at least list price (asking price or higher)?
This stat tells us how active the market is and helps our buyers to realize that, in some cases, they will be in a competitive situation.
When we look at single-family home sales so far this month, this is what we find:
57% of properties in Larimer County sell for at least list price
62% of properties in Weld County sell for at least list price
So, in well over half of the transactions, buyers need to offer list price or higher to acquire the property.
The data gets even more interesting when this information is broken out by price range.
To no one’s surprise, the percentage increases for properties priced under $400,000:
81% in Larimer County
70% in Weld County
We find that for properties over $400,000 the percentages still tell a story of a very active market:
47% in Larimer County
56% in Weld County
Bottom line, in most locations and price ranges we see a strong sellers’ market where buyers need to be prepared to make a strong offer and to also compete.
Rebound
The Case-Shiller Home Price Index tracks appreciation in the 20 largest real estate markets across the U.S.
Their most recent quarterly report was just released this week.
Metro Denver prices are up over last year by 3.89% which is just slightly higher than the average of the 20 markets.
It is interesting to see how the 20 locations have performed since the pre-Great Recession housing peak.
Turns out that Denver has done the best out of all the markets.
Since 2008, Denver home prices have appreciated 64.9%. Second-best is Dallas at 55.5% and Seattle is third at 41.2%.
Believe it or not, there are markets where average home prices have still not returned to their 2008 levels.
Las Vegas is 14.5% below 2008 and Chicago is 12.8% below.
These numbers are another indicator of the long-term health and performance of the Front Range market.
Spring in Summer

This year the Spring market is occurring in the Summer.
Typically the busiest months for real estate along the Front Range are April, May and June.
This year, because showing activity was restricted in the Spring months, we are seeing robust activity this Summer.
Here’s an indicator. Sales through July 2020 versus July 2019 are up:
12.6% in Metro Denver
13.7% in Northern Colorado
To see double-digit increases in sales despite was is occurring in the National economy, is nothing short of remarkable.
Buyer Contemplation

New research from the National Association of Home Builders:
The number of Americans contemplating purchasing a home in the second quarter of 2020 is nearly the same as 2019’s second quarter, according to NAHB’s Housing Trends Report.
At this time last year, 12% of Americans considered buying a home. Today the number stands at 11%.
The same goes for first-time prospective buyers, where 58% considered buying a home in the second quarter of 2019 and 59% are considering it in 2020’s second quarter.
In the second quarter of 2020, Millennials are the generation most likely to want to buy a home (19%), even slightly higher than a year earlier (17%).
Boomers, on the other hand, are the least likely, with the share planning a home purchase falling from 7% to 5%.
Across regions, the share of respondents who are prospective home buyers is unchanged in the Northeast (10%) and South (12%), essentially flat in the West (13%), and just slightly lower in the Midwest (down from 11% to 9%).
At Windermere Real Estate we are taking Safer at Home and Social Distancing very seriously. Our people are following our Safe Showings protocol, staying connected to their clients, and providing help wherever needed.
Housing Math

It’s interesting to look at what population growth means for housing.
On average, along the Front Range, 2.5 people live in each housing unit.
What that means is 4 housing units are needed for every 10 people who live here.
So, for every 1000 new people moving to our area, 400 new housing units are required.
The population of Metro Denver is just under 3,000,000 and the population of Northern Colorado is just over 650,000.
Assuming the Front Range grows in population at 2% per year, that means 60,000 new people in Metro Denver and 13,000 new people in Northern Colorado each year.
To house those people, 24,000 new housing units need to be built per year in Metro Denver and 5,200 in Northern Colorado.
At Windermere Real Estate we are taking Safer at Home and Social Distancing very seriously. Our people are following our Safe Showings protocol, staying connected to their clients, and providing help wherever needed.
Caught Up

We’ve been waiting for June to catch up. It finally happened (almost).
Back in April, real estate activity was significantly limited and the showing of property was restricted which caused the number of closed properties in May and early June to be much lower than last year.
Bottom line, fewer properties going under contract in April caused fewer closings 30 to 45 days later.
Closed properties in May were down compared to 2019 by 44% in Northern Colorado and 43% in Metro Denver.
Then activity jumped significantly in May. The number of properties going under contract was way up compared to last year.
We’ve been wondering when we would see this sales activity reflected in the number of closed properties.
Well, it finally happened (almost).
The number of closings so far in June compared to the same time period through June of 2019 is only down 1.8% in Northern Colorado and 1.6% in Metro Denver.
In both markets, there are only a handful of closings separating activity in June 2020 versus June 2019.
By the end of the month, when all the transactions are tallied up, we expect that June of this year will out pace June of last year in terms of number of transactions.
This is significant not only because of COVID-19, but also because of the reduced inventory compared to last year. Quite simply, there are fewer homes to buy.
All of this speaks to the health and resiliency of the Front Range market.
At Windermere Real Estate we are taking Safer at Home and Social Distancing very seriously. Our people are following our Safe Showings protocol, staying connected to their clients, and providing help wherever needed.
