About the areaBuyer TipsEvans Real EstateFort Collins Real EstateInvestmentLoveland Real EstateReal EstateSeller TipsWellington Real EstateWindsor Real Estate January 28, 2019

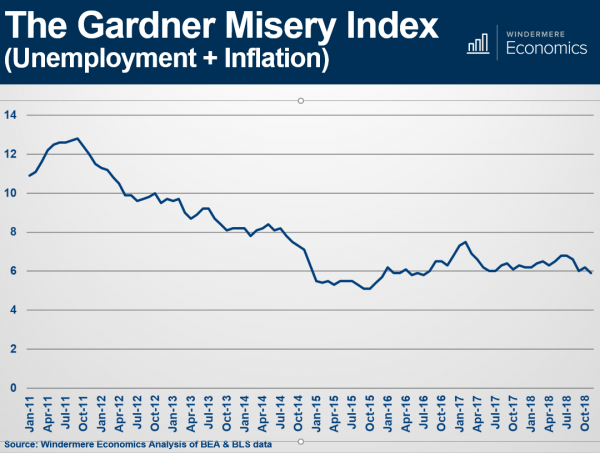
The Misery Index


Last week at our Market Forecast events, Chief Economist Matthew Gardner shared, among many stats, his famous “Misery Index.”

A valuable statistic with a funny title.

The Misery Index simply measures inflation plus unemployment.

It’s an effective way to look at our Nation’s economy.

Today’s Index sits just below 6%. Back in October 2011, it was close to 13%.

The lowest it has been in the last 7 years is October 2015 when it was near 5%.

________________________________________

If you would like a copy of the entire Forecast presentation, go ahead and reach out to me.

I would be happy to put it in your hands.

About the areaBuyer TipsFort Collins Real EstateHomes for SaleInvestmentLoveland Real EstateReal EstateSeller TipsWellington Real EstateWindsor Real Estate December 14, 2018

Friday Fun Facts

Waiting and Waiting

Anytime the market cools off we sometimes hear prospective buyers say “I think I’ll wait for the market to correct, then I’ll buy after prices come way down.”

The reality is this… History shows that this wouldn’t be a good strategy.

Our go-to source on price appreciation is the Federal Housing Finance Authority who produces a quarterly home price index.  They have been tracking Larimer County for 41 years.

Their numbers show:

  • Yearly prices have decreased only 6 times in history
  • The average amount of that decrease is only 1.7%

So, someone who is waiting for prices to drop:

  • Might be waiting a long time
  • Might be disappointed that prices didn’t drop by all that much

If you have any questions about any of this info, feel free to give me a call or shoot me an email, have a great weekend!

About the areaBuyer TipsEvans Real EstateFort Collins Real EstateHomes for SaleInvestmentLoveland Real EstateReal EstateSeller TipsWellington Real EstateWindsor Real Estate December 7, 2018

Friday Fun Facts – Good Loan News!

About the areaBuyer TipsFort Collins Real EstateHomes for SaleLoveland Real EstateReal EstateSeller TipsWellington Real EstateWindsor Real Estate November 16, 2018

Real Estate Update – The Gardner Report


The following analysis of the Metro Denver & Northern Colorado real estate market (which now includes Clear Creek, Gilpin, and Park Counties) is provided by Windermere Real Estate Chief Economist Matthew Gardner. We hope that this information may assist you with making better-informed real estate decisions. For further information about the housing market in your area, please don’t hesitate to contact your Windermere agent.


ECONOMIC OVERVIEW

The Colorado economy continues to perform quite well, having added 72,200 non-agricultural jobs over the past 12 months — a solid growth rate of 2.7%. Through the first eight months of 2018, the state has added an average of 6,700 new jobs per month. There has been a modest slowdown in employment gains, but I really don’t think this is a cause for concern and still hold to my forecast that Colorado will add a total of 82,000 new jobs by the end of 2018.

In August, the state unemployment rate was 2.9%. This matches the level seen a year ago. Unemployment rates in all the markets contained in this report rose between August 2017 and August 2018 but this is not actually a concern. Growth in the workforce is not only due to recent college graduates, but also discouraged workers who are starting to look for work again and this puts upward pressure on the unemployment rate. All of Colorado’s metropolitan areas are showing unemployment rates at around 4% or lower, suggesting that the regional economies are at, or close to, full employment.


HOME SALES ACTIVITY

  • In the third quarter of 2018, 16,550 homes sold — a drop of 6.2% compared to the third quarter of 2017.
  • Sales rose in just two of the 11 counties contained in this report. Gilpin County again led the way, with sales rising by an impressive 21.1% compared to third quarter of last year. There was also a significant increase in Clear Creek County. Sales fell the most in Arapahoe County.
  • Slowing sales in the quarter can, to a degree, be attributed to continued home price growth, but I believe it is more a function of the rapid rise in the number of homes for sale. The number of listings in third quarter rose by 5.4% over the same period in 2017, but was up by 31.2% compared to the second quarter of this year.
  • What the numbers are telling us is that inventory growth is giving buyers more choice and they are being far more selective — and patient — before making an offer on a home.


HOME PRICES

  • Even with the rapid rise in listings and slowing home sales, prices continue to trend higher. The average home price in the region rose 7.9% year-over-year to $460,982. However, the average price dropped 4% between second and third quarters.
  • The smallest price gains in the region were in Park County, where prices rose by a fairly modest 3.6%.
  • Appreciation was strongest in Clear Creek County, where prices rose 10%. All other counties in this report saw gains relative to the third quarter of 2017.
  • Affordability is becoming an issue in many Colorado markets and this, in concert with rising inventory levels, has started to dampen home price growth. Although I do not expect prices to drop, I do think price gains will moderate over the next few quarters.


DAYS ON MARKET

  • The average number of days it took to sell a home in Colorado remained at the same level as a year ago.
  • The amount of time it took to sell a home dropped in three counties: Gilpin, Clear Creek, and Larimer. The rest of the counties in this report saw days on market rise by only a couple of days or less.
  • In the third quarter of 2018, it took an average of 24 days to sell a home. It took less than a month to sell a home in all but one county.
  • Housing demand is still solid and, as long as homes are priced appropriately, they will continue to sell in less time than historic averages.


CONCLUSIONS

This speedometer reflects the state of the region’s real estate market using housing inventory, price gains, home sales, interest rates, and larger economic factors.

For the third quarter of 2018, I continue the trend that I started last quarter and have moved the needle a little more in favor of buyers. Listings are likely to continue their rising trend, but we should still see a seasonal drop off during the winter months. The market is clearly headed toward balance, which I am very pleased to see.


Matthew Gardner is the Chief Economist for Windermere Real Estate, specializing in residential market analysis, commercial/industrial market analysis, financial analysis, and land use and regional economics. He is the former Principal of Gardner Economics, and has more than 30 years of professional experience both in the U.S. and U.K.

About the areaBuyer TipsFort Collins Real EstateHomes for SaleInvestmentLoveland Real EstateReal EstateSeller TipsWellington Real EstateWindsor Real Estate November 12, 2018

96.3 Miles Per Hour

96.3 Miles Per Hour


Pretend you have been driving on the Interstate at 100 miles per hour.

Also, pretend you have been doing that for a long time.

Now pretend you slow down to 96.3 miles per hour.

How would that feel?

Probably just a little slower?

96.3 miles per hour is a 3.7% decrease from 100. It may feel slower, but it’s still pretty fast.

How does this relate to real estate?

Well, the market has been moving fast for a long time.

It’s been going 100 miles per hour for at least two years (some would argue even longer).

We’ve recently seen a 3.7% change in terms of number of transactions that are occurring.

There were 3.7% fewer sales in September 2018 versus September 2017 in Fort Collins.

It feels slower because we’ve been driving so fast for so long. But, our market is still moving.

For example, prices are still up. So, remember, that it’s all relative.

About the areaBuyer TipsFort Collins Real EstateInvestmentLoveland Real EstateReal EstateWellington Real EstateWindsor Real Estate October 26, 2018

Friday Fun Facts!

About the areaBuyer TipsFort Collins Real EstateHomes for SaleInvestmentLoveland Real EstateReal EstateSeller TipsWellington Real EstateWindsor Real Estate September 21, 2018

Friday Fun Facts – Appreciation

About the areaBuyer TipsFort Collins Real EstateHomes for SaleInvestmentLoveland Real EstateReal EstateSeller TipsWellington Real EstateWindsor Real Estate September 7, 2018

Friday Fun Facts! The Cost of Waiting

About the areaBuyer TipsFort Collins Real EstateHomes for SaleInvestmentLoveland Real EstateReal EstateSeller TipsWellington Real EstateWindsor Real Estate August 31, 2018

Friday Fun Facts!

About the areaBuyer TipsFort Collins Real EstateReal EstateSeller Tips June 15, 2018

Friday Fun Facts!

image

Double Up

Fort Collins, over the last 12 months, has seen sales of homes priced $1,000,000 and over almost double.

There have been 47 sales of these luxury properties during the last year compared to 24 sales the year before that.

The current pace of roughly 4 of these properties selling per month is both unprecedented and very different compared to the other Northern Colorado markets.

Loveland, Greeley and Windsor have only seen very slight increases in sales of homes priced over $1,000,000.

So where are these homes selling in Fort Collins? These are the top neighborhoods for luxury sales:

  1. Fossil Lake Ranch
  2. Old Town
  3. The Hill at Cobb Lake
  4. Linden Lake